Estimated Value: $271,000 - $359,000
5
Beds
2
Baths
2,893
Sq Ft
$108/Sq Ft
Est. Value
About This Home
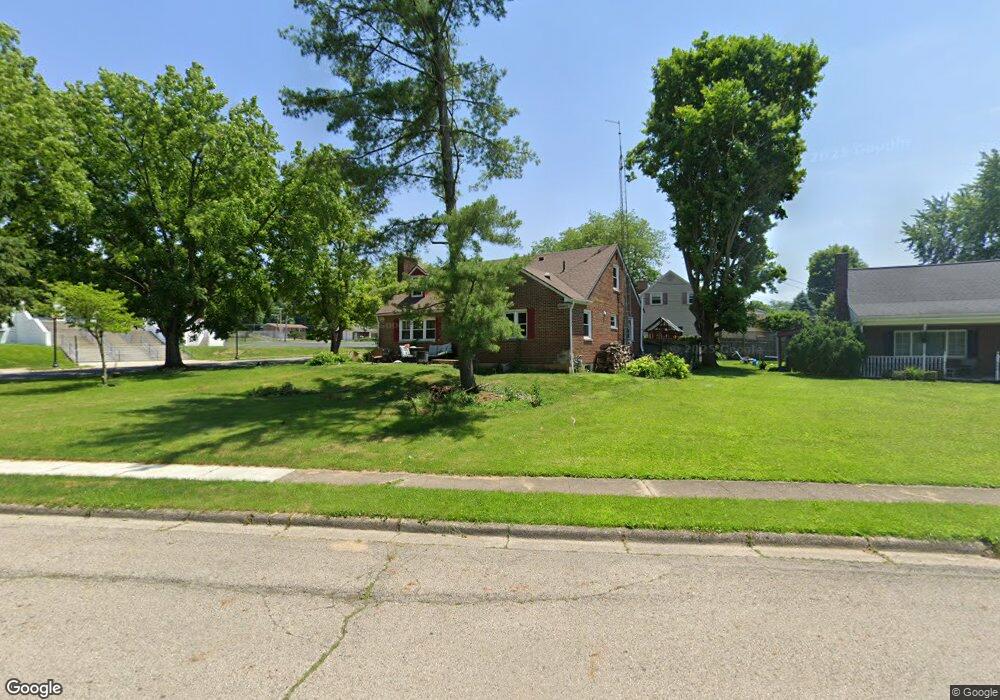
This home is located at 169 Park Dr, Xenia, OH 45385 and is currently estimated at $313,162, approximately $108 per square foot. 169 Park Dr is a home located in Greene County with nearby schools including Xenia High School, Summit Academy Community School for Alternative Learners - Xenia, and Legacy Christian Academy.
Ownership History
Date
Name
Owned For
Owner Type
Purchase Details
Closed on
Apr 18, 2017
Sold by
Norris Gary and Norris Debbie
Bought by
Hamilton Michael Thomas
Current Estimated Value
Home Financials for this Owner
Home Financials are based on the most recent Mortgage that was taken out on this home.
Original Mortgage
$156,690
Outstanding Balance
$130,461
Interest Rate
4.23%
Mortgage Type
New Conventional
Estimated Equity
$182,701
Purchase Details
Closed on
Sep 2, 2015
Sold by
Us Bank Of Na
Bought by
Norris Gary and Norris Debbie
Purchase Details
Closed on
Oct 13, 2014
Sold by
Johnson Randall M
Bought by
U S Bank Na
Purchase Details
Closed on
Dec 22, 2000
Sold by
Nunez Anthony C and Nunez Lisa K
Bought by
Johnson Randall M
Purchase Details
Closed on
Sep 12, 1995
Sold by
Jean E Klose Est
Bought by
Nunez Anthony C and Nunez K
Home Financials for this Owner
Home Financials are based on the most recent Mortgage that was taken out on this home.
Original Mortgage
$135,950
Interest Rate
7.76%
Mortgage Type
VA
Create a Home Valuation Report for This Property
The Home Valuation Report is an in-depth analysis detailing your home's value as well as a comparison with similar homes in the area
Home Values in the Area
Average Home Value in this Area
Purchase History
| Date | Buyer | Sale Price | Title Company |
|---|---|---|---|
| Hamilton Michael Thomas | $174,100 | None Available | |
| Norris Gary | $60,799 | Attorney | |
| U S Bank Na | $106,000 | None Available | |
| Johnson Randall M | $156,900 | -- | |
| Nunez Anthony C | $132,000 | -- |
Source: Public Records
Mortgage History
| Date | Status | Borrower | Loan Amount |
|---|---|---|---|
| Open | Hamilton Michael Thomas | $156,690 | |
| Previous Owner | Nunez Anthony C | $135,950 |
Source: Public Records
Tax History Compared to Growth
Tax History
| Year | Tax Paid | Tax Assessment Tax Assessment Total Assessment is a certain percentage of the fair market value that is determined by local assessors to be the total taxable value of land and additions on the property. | Land | Improvement |
|---|---|---|---|---|
| 2024 | $3,440 | $82,510 | $5,240 | $77,270 |
| 2023 | $3,440 | $85,610 | $5,240 | $80,370 |
| 2022 | $3,126 | $63,910 | $3,280 | $60,630 |
| 2021 | $3,168 | $63,910 | $3,280 | $60,630 |
| 2020 | $3,032 | $63,910 | $3,280 | $60,630 |
| 2019 | $3,292 | $65,320 | $4,420 | $60,900 |
| 2018 | $3,305 | $65,320 | $4,420 | $60,900 |
| 2017 | $3,295 | $65,320 | $4,420 | $60,900 |
| 2016 | $3,024 | $57,130 | $4,420 | $52,710 |
| 2015 | $3,216 | $57,130 | $4,420 | $52,710 |
| 2014 | $92 | $57,130 | $4,420 | $52,710 |
Source: Public Records
Map
Nearby Homes
- 151 Park Dr
- 316 Edison Blvd
- 304 Edison Blvd
- 141 Park Dr
- 292 Edison Blvd
- 129 Park Dr
- 150 Sheridan Ave
- 140 Sheridan Ave
- 109 Park Dr
- 262 Edison Blvd
- 273 Edison Blvd
- 128 Sheridan Ave
- 101 Park Dr
- 252 Edison Blvd
- 261 Edison Blvd
- 120 Sheridan Ave
- 244 Edison Blvd
- 221 Garfield Ave
- 247 Edison Blvd
- 108 Sheridan Ave