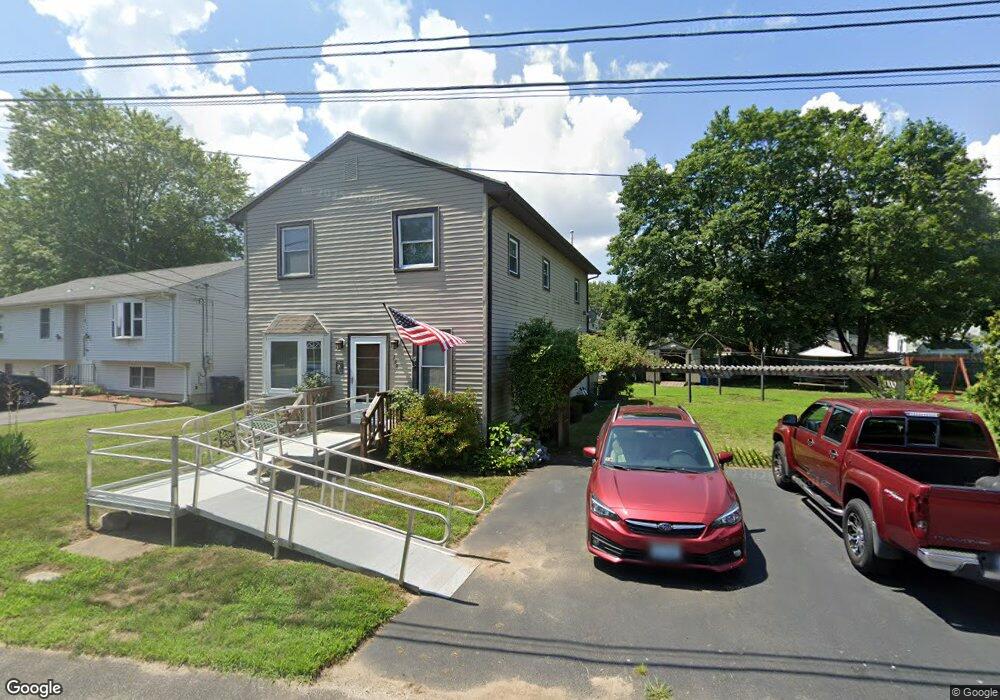
169 Pequot Ave Warwick, RI 02889
Oakland Beach NeighborhoodEstimated Value: $369,000 - $422,000
4
Beds
1
Bath
1,638
Sq Ft
$241/Sq Ft
Est. Value
About This Home
This home is located at 169 Pequot Ave, Warwick, RI 02889 and is currently estimated at $394,041, approximately $240 per square foot. 169 Pequot Ave is a home located in Kent County with nearby schools including Saint Kevin School and Bishop Hendricken High School.
Ownership History
Date
Name
Owned For
Owner Type
Purchase Details
Closed on
Aug 7, 2015
Sold by
Grondin David
Bought by
Grondin David and Grondin Susan
Current Estimated Value
Home Financials for this Owner
Home Financials are based on the most recent Mortgage that was taken out on this home.
Original Mortgage
$76,000
Outstanding Balance
$59,446
Interest Rate
4.03%
Mortgage Type
New Conventional
Estimated Equity
$334,595
Purchase Details
Closed on
Dec 20, 2007
Sold by
Martin Linda
Bought by
Grondin David and Grondin Susan
Home Financials for this Owner
Home Financials are based on the most recent Mortgage that was taken out on this home.
Original Mortgage
$80,000
Interest Rate
6.3%
Mortgage Type
Purchase Money Mortgage
Purchase Details
Closed on
Sep 12, 2006
Sold by
Grondin Susan J
Bought by
Martin Linda
Home Financials for this Owner
Home Financials are based on the most recent Mortgage that was taken out on this home.
Original Mortgage
$66,500
Interest Rate
6.79%
Mortgage Type
Purchase Money Mortgage
Create a Home Valuation Report for This Property
The Home Valuation Report is an in-depth analysis detailing your home's value as well as a comparison with similar homes in the area
Home Values in the Area
Average Home Value in this Area
Purchase History
| Date | Buyer | Sale Price | Title Company |
|---|---|---|---|
| Grondin David | -- | -- | |
| Grondin David | $100,000 | -- | |
| Martin Linda | $83,500 | -- |
Source: Public Records
Mortgage History
| Date | Status | Borrower | Loan Amount |
|---|---|---|---|
| Open | Martin Linda | $76,000 | |
| Previous Owner | Martin Linda | $80,000 | |
| Previous Owner | Martin Linda | $66,500 |
Source: Public Records
Tax History Compared to Growth
Tax History
| Year | Tax Paid | Tax Assessment Tax Assessment Total Assessment is a certain percentage of the fair market value that is determined by local assessors to be the total taxable value of land and additions on the property. | Land | Improvement |
|---|---|---|---|---|
| 2025 | $4,694 | $369,600 | $99,900 | $269,700 |
| 2024 | $4,117 | $284,500 | $86,900 | $197,600 |
| 2023 | $4,037 | $284,500 | $86,900 | $197,600 |
| 2022 | $3,791 | $202,400 | $51,000 | $151,400 |
| 2021 | $3,791 | $202,400 | $51,000 | $151,400 |
| 2020 | $3,791 | $202,400 | $51,000 | $151,400 |
| 2019 | $3,791 | $202,400 | $51,000 | $151,400 |
| 2018 | $3,232 | $155,400 | $51,000 | $104,400 |
| 2017 | $3,145 | $155,400 | $51,000 | $104,400 |
| 2016 | $3,145 | $155,400 | $51,000 | $104,400 |
| 2015 | $3,445 | $166,000 | $56,400 | $109,600 |
| 2014 | $3,330 | $166,000 | $56,400 | $109,600 |
| 2013 | $3,285 | $166,000 | $56,400 | $109,600 |
Source: Public Records
Map
Nearby Homes
- 177 Pequot Ave
- 518 Oakland Beach Ave
- 506 Oakland Beach Ave
- 168 Pequot Ave
- 504 Oakland Beach Ave
- 1 Orms St
- 174 Pequot Ave
- 15 Orms St
- 5 Orms St
- 185 Pequot Ave
- 156 Pequot Ave
- 52 N Shore St
- 139 Pequot Ave
- 29 Crown St
- 9 Northup St
- 517 Oakland Beach Ave
- 490 Oakland Beach Ave
- 0 Pinehurst Ave
- 521 Oakland Beach Ave
- 199 Pequot Ave