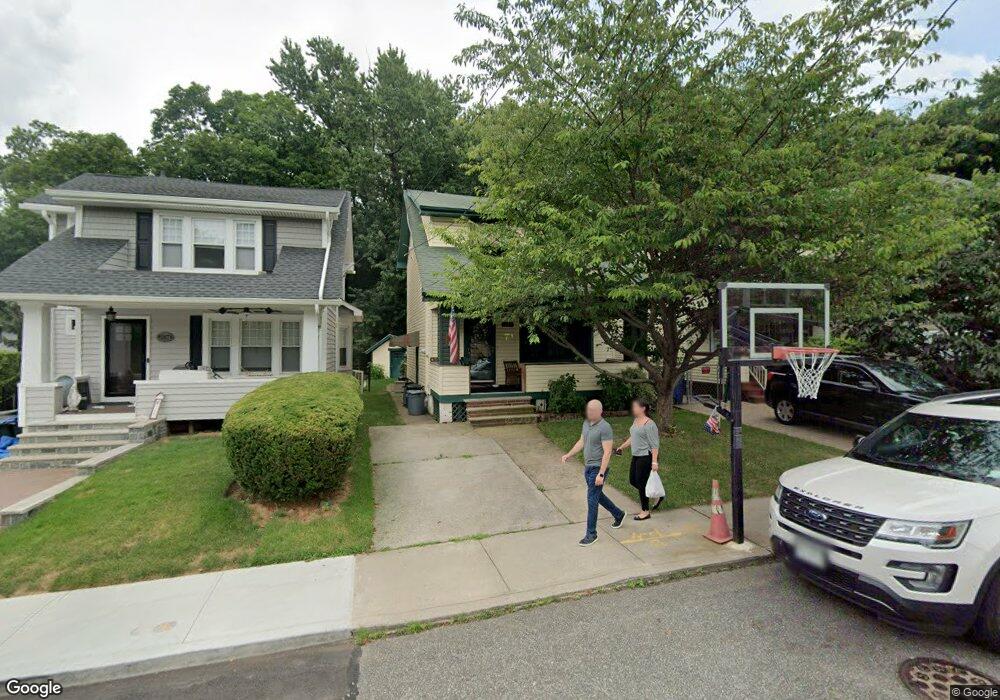
169 Raymond Place Staten Island, NY 10310
Castleton Corners NeighborhoodEstimated Value: $573,971 - $762,000
--
Bed
4
Baths
1,025
Sq Ft
$661/Sq Ft
Est. Value
About This Home
This home is located at 169 Raymond Place, Staten Island, NY 10310 and is currently estimated at $677,243, approximately $660 per square foot. 169 Raymond Place is a home located in Richmond County with nearby schools including P.S. 19 The Curtis School, Intermediate School 27, and Susan E Wagner High School.
Ownership History
Date
Name
Owned For
Owner Type
Purchase Details
Closed on
Mar 12, 2004
Sold by
Walsh Kevin Michael and Coyle Walsh Patricia M
Bought by
Wing Scott J and Wing Patricia S
Current Estimated Value
Home Financials for this Owner
Home Financials are based on the most recent Mortgage that was taken out on this home.
Original Mortgage
$288,000
Outstanding Balance
$134,410
Interest Rate
5.65%
Mortgage Type
Purchase Money Mortgage
Estimated Equity
$542,833
Purchase Details
Closed on
Jul 2, 1999
Sold by
Shiel Michael F and Shiel Mariead M
Bought by
Walsh Kevin Michael and Coyle Walsh Patricia M
Home Financials for this Owner
Home Financials are based on the most recent Mortgage that was taken out on this home.
Original Mortgage
$150,000
Interest Rate
7.39%
Purchase Details
Closed on
Oct 11, 1995
Sold by
Schwall Agnes A
Bought by
Shiel Michael F and Shiel Mairead M
Home Financials for this Owner
Home Financials are based on the most recent Mortgage that was taken out on this home.
Original Mortgage
$137,700
Interest Rate
7.6%
Create a Home Valuation Report for This Property
The Home Valuation Report is an in-depth analysis detailing your home's value as well as a comparison with similar homes in the area
Home Values in the Area
Average Home Value in this Area
Purchase History
| Date | Buyer | Sale Price | Title Company |
|---|---|---|---|
| Wing Scott J | $360,000 | -- | |
| Walsh Kevin Michael | $205,000 | First American Title Ins Co | |
| Shiel Michael F | $153,000 | -- |
Source: Public Records
Mortgage History
| Date | Status | Borrower | Loan Amount |
|---|---|---|---|
| Open | Wing Scott J | $288,000 | |
| Previous Owner | Walsh Kevin Michael | $150,000 | |
| Previous Owner | Shiel Michael F | $137,700 |
Source: Public Records
Tax History Compared to Growth
Tax History
| Year | Tax Paid | Tax Assessment Tax Assessment Total Assessment is a certain percentage of the fair market value that is determined by local assessors to be the total taxable value of land and additions on the property. | Land | Improvement |
|---|---|---|---|---|
| 2025 | $5,877 | $35,100 | $8,739 | $26,361 |
| 2024 | $5,877 | $33,660 | $8,972 | $24,688 |
| 2023 | $5,607 | $27,608 | $7,561 | $20,047 |
| 2022 | $5,245 | $36,300 | $10,320 | $25,980 |
| 2021 | $5,515 | $31,740 | $10,320 | $21,420 |
| 2020 | $5,243 | $28,440 | $10,320 | $18,120 |
| 2019 | $5,101 | $27,600 | $10,320 | $17,280 |
| 2018 | $4,690 | $23,007 | $7,994 | $15,013 |
| 2017 | $4,463 | $21,896 | $9,075 | $12,821 |
| 2016 | $4,366 | $21,840 | $10,320 | $11,520 |
| 2015 | $3,900 | $20,640 | $11,460 | $9,180 |
| 2014 | $3,900 | $20,322 | $11,283 | $9,039 |
Source: Public Records
Map
Nearby Homes
- 771 Delafield Ave
- 6 Ludwig St
- 10 Ludwig St
- 448 Clove Rd
- 704 Delafield Ave
- 837 Delafield Ave Unit A
- 433 Clove Rd
- 109 Lyceum Ct
- 246 Dubois Ave
- 886 Delafield Ave
- 61 Greenleaf Ave
- 62 Lyceum Ct
- 657 Delafield Ave
- 176 Dubois Ave
- 12 Freeman Place
- 79 Mundy Ave
- 123 Roe St
- 122 Kingsley Ave
- 138 Kingsley Ave
- 722 Post Ave
- 171 Raymond Place
- 167 Raymond Place
- 173 Raymond Place
- 175 Raymond Place
- 177 Raymond Place
- 181 Raymond Place
- 1010 Forest Ave
- 172 Raymond Place
- 162 Raymond Place
- 176 Raymond Place
- 187 Raymond Place
- 1002 Forest Ave Unit 2
- 1002 Forest Ave
- 180 Raymond Place
- 166 Raymond Place
- 191 Raymond Place
- 1034 Forest Ave
- 184 Raymond Place
- 193 Raymond Place
- 188 Raymond Place