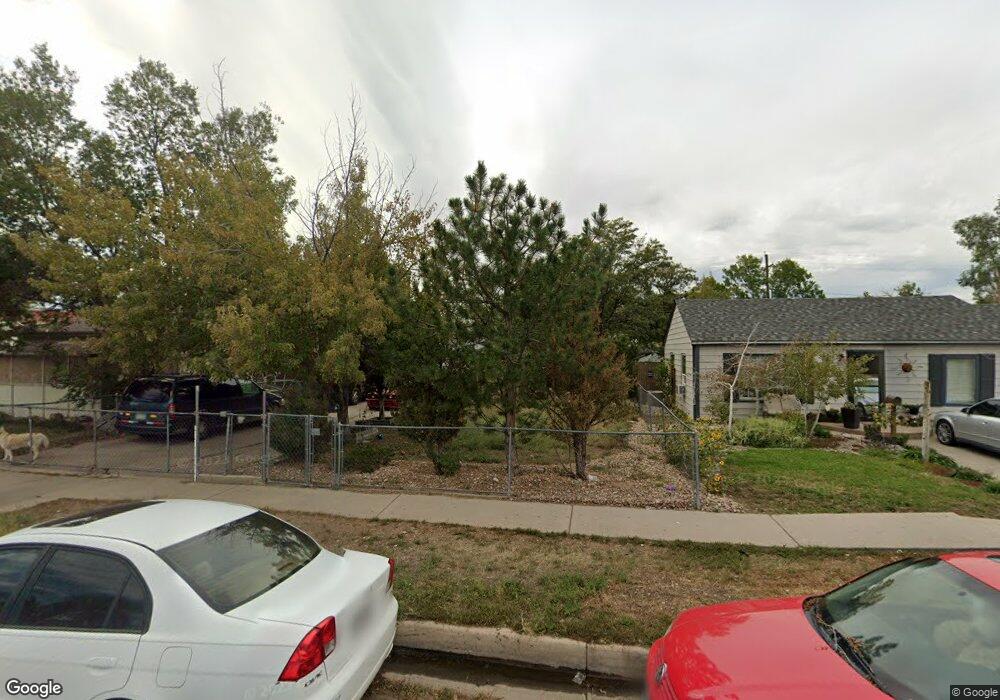
169 S 9th Ave Brighton, CO 80601
Estimated Value: $320,000 - $353,000
2
Beds
1
Bath
840
Sq Ft
$400/Sq Ft
Est. Value
About This Home
This home is located at 169 S 9th Ave, Brighton, CO 80601 and is currently estimated at $335,749, approximately $399 per square foot. 169 S 9th Ave is a home located in Adams County with nearby schools including Southeast Elementary School, Vikan Middle School, and Brighton High School.
Ownership History
Date
Name
Owned For
Owner Type
Purchase Details
Closed on
Jul 12, 2023
Sold by
Torres Jose Socorro
Bought by
Detorres Silvia Cristina Qui and Detorres Socorro Lemus
Current Estimated Value
Purchase Details
Closed on
Apr 6, 1999
Sold by
Livingston Ken D and Livingston Christy
Bought by
Torres Jose Socorro
Home Financials for this Owner
Home Financials are based on the most recent Mortgage that was taken out on this home.
Original Mortgage
$79,877
Interest Rate
6.89%
Mortgage Type
FHA
Purchase Details
Closed on
Mar 30, 1999
Sold by
Sublette Reed Bonnie and Dba B Etal
Bought by
Livingston Ken D and Livingston Christy
Home Financials for this Owner
Home Financials are based on the most recent Mortgage that was taken out on this home.
Original Mortgage
$79,877
Interest Rate
6.89%
Mortgage Type
FHA
Create a Home Valuation Report for This Property
The Home Valuation Report is an in-depth analysis detailing your home's value as well as a comparison with similar homes in the area
Home Values in the Area
Average Home Value in this Area
Purchase History
| Date | Buyer | Sale Price | Title Company |
|---|---|---|---|
| Detorres Silvia Cristina Qui | -- | None Listed On Document | |
| Torres Jose Socorro | $80,000 | -- | |
| Livingston Ken D | -- | -- |
Source: Public Records
Mortgage History
| Date | Status | Borrower | Loan Amount |
|---|---|---|---|
| Previous Owner | Torres Jose Socorro | $79,877 |
Source: Public Records
Tax History Compared to Growth
Tax History
| Year | Tax Paid | Tax Assessment Tax Assessment Total Assessment is a certain percentage of the fair market value that is determined by local assessors to be the total taxable value of land and additions on the property. | Land | Improvement |
|---|---|---|---|---|
| 2024 | $2,223 | $20,440 | $5,310 | $15,130 |
| 2023 | $2,212 | $23,810 | $5,410 | $18,400 |
| 2022 | $2,241 | $20,400 | $4,930 | $15,470 |
| 2021 | $2,101 | $20,400 | $4,930 | $15,470 |
| 2020 | $1,768 | $17,900 | $4,860 | $13,040 |
| 2019 | $1,769 | $17,900 | $4,860 | $13,040 |
| 2018 | $1,078 | $10,900 | $4,750 | $6,150 |
| 2017 | $1,077 | $10,900 | $4,750 | $6,150 |
| 2016 | $518 | $5,230 | $2,390 | $2,840 |
| 2015 | $517 | $5,230 | $2,390 | $2,840 |
| 2014 | $715 | $7,340 | $1,910 | $5,430 |
Source: Public Records
Map
Nearby Homes