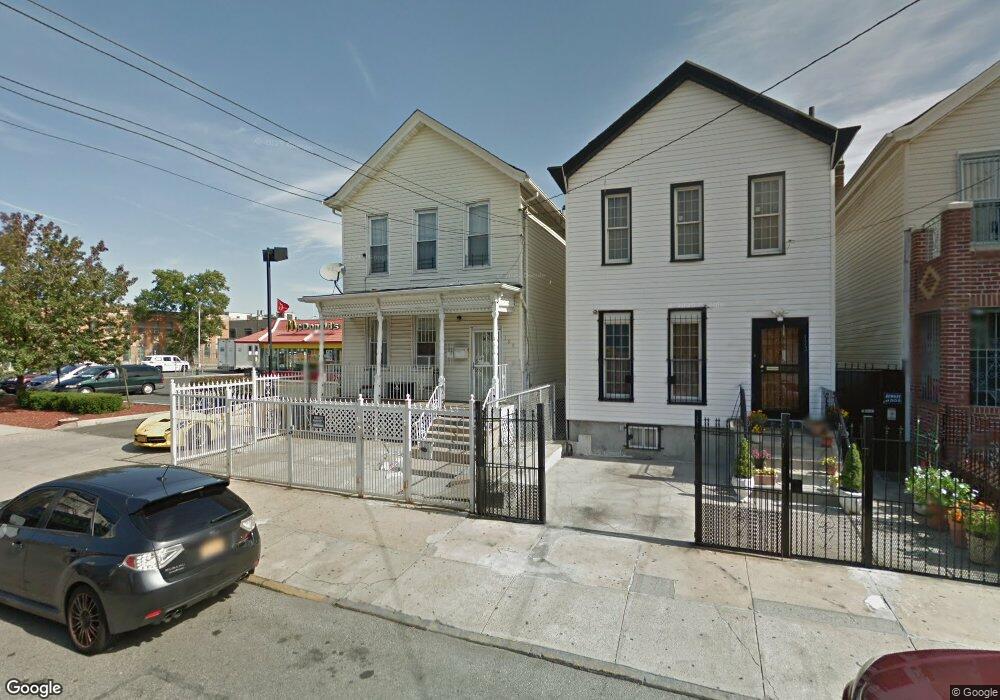
169 van Siclen Ave Brooklyn, NY 11207
East New York NeighborhoodEstimated Value: $606,000 - $794,000
Studio
--
Bath
1,536
Sq Ft
$473/Sq Ft
Est. Value
About This Home
This home is located at 169 van Siclen Ave, Brooklyn, NY 11207 and is currently estimated at $726,366, approximately $472 per square foot. 169 van Siclen Ave is a home located in Kings County with nearby schools including P.S. 149 Danny Kaye, Vista Academy, and Liberty Avenue Middle School.
Ownership History
Date
Name
Owned For
Owner Type
Purchase Details
Closed on
Oct 24, 2012
Sold by
Dormoy Cecile
Bought by
Kabir Jahangir M
Current Estimated Value
Home Financials for this Owner
Home Financials are based on the most recent Mortgage that was taken out on this home.
Original Mortgage
$161,000
Outstanding Balance
$110,855
Interest Rate
3.39%
Mortgage Type
New Conventional
Estimated Equity
$615,511
Purchase Details
Closed on
Oct 12, 2004
Sold by
Rebecca Inc
Bought by
Dormoy Cecile and Robin Charles
Home Financials for this Owner
Home Financials are based on the most recent Mortgage that was taken out on this home.
Original Mortgage
$287,976
Interest Rate
5.74%
Mortgage Type
Purchase Money Mortgage
Purchase Details
Closed on
Aug 2, 2004
Sold by
Brown Tyronne
Bought by
Rebecca Inc
Home Financials for this Owner
Home Financials are based on the most recent Mortgage that was taken out on this home.
Original Mortgage
$160,000
Interest Rate
6.16%
Mortgage Type
Purchase Money Mortgage
Create a Home Valuation Report for This Property
The Home Valuation Report is an in-depth analysis detailing your home's value as well as a comparison with similar homes in the area
Home Values in the Area
Average Home Value in this Area
Purchase History
| Date | Buyer | Sale Price | Title Company |
|---|---|---|---|
| Kabir Jahangir M | $215,000 | -- | |
| Dormoy Cecile | $359,970 | -- | |
| Rebecca Inc | $150,000 | -- |
Source: Public Records
Mortgage History
| Date | Status | Borrower | Loan Amount |
|---|---|---|---|
| Open | Kabir Jahangir M | $161,000 | |
| Previous Owner | Dormoy Cecile | $287,976 | |
| Previous Owner | Rebecca Inc | $160,000 |
Source: Public Records
Tax History
| Year | Tax Paid | Tax Assessment Tax Assessment Total Assessment is a certain percentage of the fair market value that is determined by local assessors to be the total taxable value of land and additions on the property. | Land | Improvement |
|---|---|---|---|---|
| 2025 | $2,770 | $46,860 | $11,520 | $35,340 |
| 2024 | $2,770 | $44,220 | $11,520 | $32,700 |
| 2023 | $2,648 | $39,840 | $11,520 | $28,320 |
| 2022 | $2,460 | $35,340 | $11,520 | $23,820 |
| 2021 | $2,450 | $38,580 | $11,520 | $27,060 |
| 2020 | $1,834 | $38,940 | $11,520 | $27,420 |
| 2019 | $2,404 | $38,940 | $11,520 | $27,420 |
| 2018 | $2,215 | $10,866 | $3,692 | $7,174 |
| 2017 | $2,093 | $10,268 | $3,975 | $6,293 |
| 2016 | $1,940 | $9,703 | $4,801 | $4,902 |
| 2015 | $1,168 | $9,703 | $3,910 | $5,793 |
| 2014 | $1,168 | $9,578 | $4,630 | $4,948 |
Source: Public Records
Map
Nearby Homes
- 202 Schenck Ave
- 207 Bradford St
- 168 Miller Ave
- 2830 Fulton St
- 90 Wyona St
- 597 Liberty Ave
- 599 Liberty Ave
- 279 van Siclen Ave
- 323 Barbey St
- 153 Hendrix St
- 221 Barbey St
- 243 Wyona St
- 107 Miller Ave
- 57 Wyona St
- 52 Bradford St
- 239 New Jersey Ave
- 200 New Jersey Ave
- 87 Schenck Ave
- 396 Barbey St
- 126 Jerome St
- 173 van Siclen Ave
- 175 van Siclen Ave
- 2792 Atlantic Ave
- 2800 Atlantic Ave
- 2788 Atlantic Ave
- 185 van Siclen Ave
- 170 van Siclen Ave
- 174 Van Sicklen St
- 174 van Siclen Ave
- 2786 Atlantic Ave
- 176 van Siclen Ave
- 182 Liberty Ave
- 180 van Siclen Ave
- 186 van Siclen Ave
- 182 van Siclen Ave
- 517 Liberty Ave
- 511 Liberty Ave
- 186 Liberty Ave
- 515 Liberty Ave
- 515 Liberty Ave
Your Personal Tour Guide
Ask me questions while you tour the home.