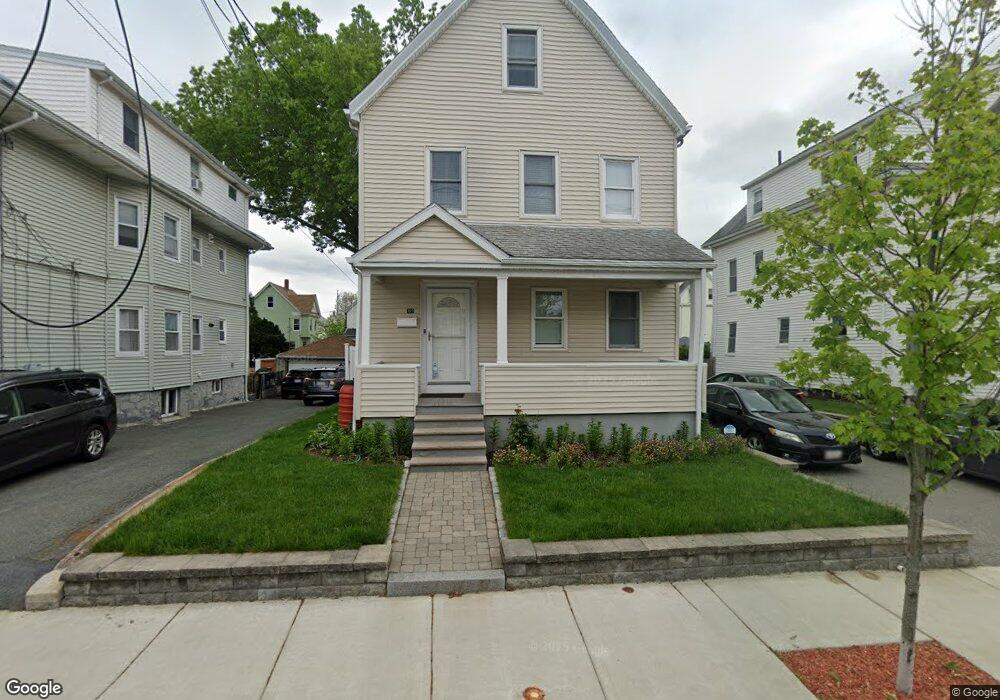
169 Vine St Everett, MA 02149
Glendale NeighborhoodEstimated Value: $644,000 - $1,127,000
4
Beds
3
Baths
1,678
Sq Ft
$492/Sq Ft
Est. Value
About This Home
This home is located at 169 Vine St, Everett, MA 02149 and is currently estimated at $826,310, approximately $492 per square foot. 169 Vine St is a home located in Middlesex County with nearby schools including Everett High School, Pioneer Charter School of Science, and St Anthony School.
Ownership History
Date
Name
Owned For
Owner Type
Purchase Details
Closed on
Jan 23, 2002
Sold by
Capodilupo John P
Bought by
Lott Clatson M
Current Estimated Value
Home Financials for this Owner
Home Financials are based on the most recent Mortgage that was taken out on this home.
Original Mortgage
$196,000
Outstanding Balance
$80,323
Interest Rate
7.08%
Mortgage Type
Purchase Money Mortgage
Estimated Equity
$745,987
Create a Home Valuation Report for This Property
The Home Valuation Report is an in-depth analysis detailing your home's value as well as a comparison with similar homes in the area
Home Values in the Area
Average Home Value in this Area
Purchase History
| Date | Buyer | Sale Price | Title Company |
|---|---|---|---|
| Lott Clatson M | $245,000 | -- |
Source: Public Records
Mortgage History
| Date | Status | Borrower | Loan Amount |
|---|---|---|---|
| Open | Lott Clatson M | $196,000 |
Source: Public Records
Tax History
| Year | Tax Paid | Tax Assessment Tax Assessment Total Assessment is a certain percentage of the fair market value that is determined by local assessors to be the total taxable value of land and additions on the property. | Land | Improvement |
|---|---|---|---|---|
| 2025 | $7,445 | $653,600 | $270,400 | $383,200 |
| 2024 | $6,884 | $600,700 | $247,200 | $353,500 |
| 2023 | $6,730 | $571,300 | $236,900 | $334,400 |
| 2022 | $5,458 | $526,800 | $216,300 | $310,500 |
| 2021 | $4,680 | $474,200 | $182,800 | $291,400 |
| 2020 | $4,844 | $455,300 | $182,800 | $272,500 |
| 2019 | $5,083 | $410,600 | $170,500 | $240,100 |
| 2018 | $4,932 | $357,900 | $148,300 | $209,600 |
| 2017 | $4,364 | $302,200 | $113,300 | $188,900 |
| 2016 | $4,247 | $293,900 | $112,500 | $181,400 |
| 2015 | $3,962 | $271,200 | $97,900 | $173,300 |
Source: Public Records
Map
Nearby Homes
- 20 Ferry St Unit B
- 238 Chelsea St
- 40 Baker Rd
- 181 Chelsea St
- 110 Ferry St
- 148 Florence St
- 114 Francis St
- 121 Cottage St
- 105 Summer St
- 18 Winter St
- 12 Hamilton St Unit 8
- 37 Argyle St
- 56 Mansfield St
- 55 Garland St
- 20 Derne St
- 11 Hampshire St
- 44-46 Cabot St
- 7 Hampshire St
- 30 Chelsea St Unit 210
- 30 Clarence St
Your Personal Tour Guide
Ask me questions while you tour the home.