Estimated Value: $272,723 - $323,000
3
Beds
2
Baths
3,542
Sq Ft
$85/Sq Ft
Est. Value
About This Home
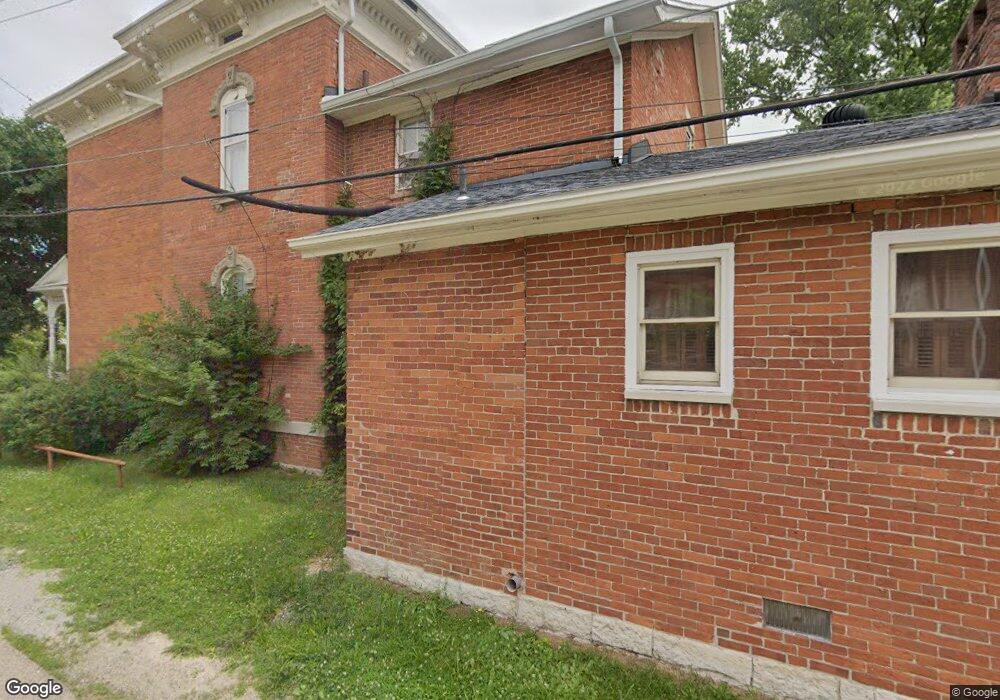
This home is located at 169 W 3rd St, Xenia, OH 45385 and is currently estimated at $301,931, approximately $85 per square foot. 169 W 3rd St is a home located in Greene County with nearby schools including Xenia High School, Summit Academy Community School for Alternative Learners - Xenia, and Legacy Christian Academy.
Ownership History
Date
Name
Owned For
Owner Type
Purchase Details
Closed on
Mar 30, 2016
Sold by
Hacker Julius and Hacker Gloria E
Bought by
Haas Lauren A
Current Estimated Value
Home Financials for this Owner
Home Financials are based on the most recent Mortgage that was taken out on this home.
Original Mortgage
$152,192
Outstanding Balance
$119,662
Interest Rate
3.37%
Mortgage Type
FHA
Estimated Equity
$182,269
Purchase Details
Closed on
Oct 22, 1996
Sold by
Fritz Thomas L
Bought by
Hacker Julius C and Hacker E
Home Financials for this Owner
Home Financials are based on the most recent Mortgage that was taken out on this home.
Original Mortgage
$119,583
Interest Rate
8.5%
Mortgage Type
VA
Create a Home Valuation Report for This Property
The Home Valuation Report is an in-depth analysis detailing your home's value as well as a comparison with similar homes in the area
Home Values in the Area
Average Home Value in this Area
Purchase History
| Date | Buyer | Sale Price | Title Company |
|---|---|---|---|
| Haas Lauren A | $155,000 | None Available | |
| Hacker Julius C | $116,100 | -- |
Source: Public Records
Mortgage History
| Date | Status | Borrower | Loan Amount |
|---|---|---|---|
| Open | Haas Lauren A | $152,192 | |
| Previous Owner | Hacker Julius C | $119,583 |
Source: Public Records
Tax History Compared to Growth
Tax History
| Year | Tax Paid | Tax Assessment Tax Assessment Total Assessment is a certain percentage of the fair market value that is determined by local assessors to be the total taxable value of land and additions on the property. | Land | Improvement |
|---|---|---|---|---|
| 2024 | $3,714 | $86,800 | $5,430 | $81,370 |
| 2023 | $3,714 | $86,800 | $5,430 | $81,370 |
| 2022 | $3,442 | $64,950 | $4,340 | $60,610 |
| 2021 | $3,302 | $64,950 | $4,340 | $60,610 |
| 2020 | $3,164 | $64,950 | $4,340 | $60,610 |
| 2019 | $2,619 | $50,620 | $5,030 | $45,590 |
| 2018 | $2,630 | $50,620 | $5,030 | $45,590 |
| 2017 | $2,089 | $50,620 | $5,030 | $45,590 |
| 2016 | $2,090 | $40,560 | $5,030 | $35,530 |
| 2015 | $2,096 | $40,560 | $5,030 | $35,530 |
| 2014 | $2,005 | $40,560 | $5,030 | $35,530 |
Source: Public Records
Map
Nearby Homes