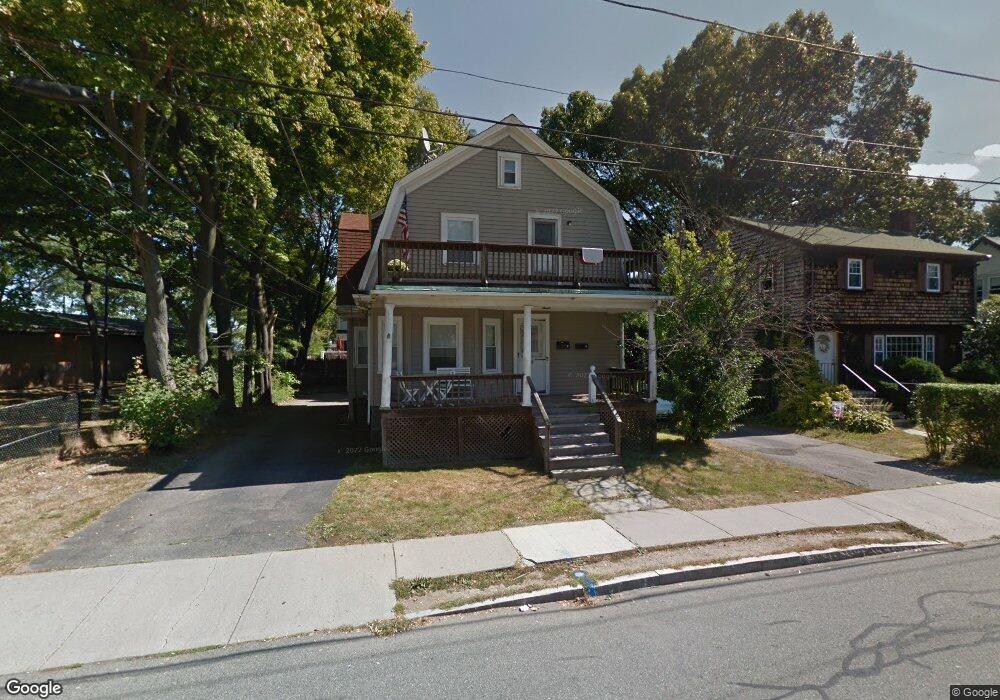
169 W Elm Ave Unit 2 Quincy, MA 02170
Wollaston NeighborhoodEstimated Value: $687,000 - $949,000
2
Beds
1
Bath
1,000
Sq Ft
$808/Sq Ft
Est. Value
About This Home
This home is located at 169 W Elm Ave Unit 2, Quincy, MA 02170 and is currently estimated at $808,180, approximately $808 per square foot. 169 W Elm Ave Unit 2 is a home located in Norfolk County with nearby schools including Beechwood Knoll Elementary School, Atlantic Middle School, and North Quincy High School.
Ownership History
Date
Name
Owned For
Owner Type
Purchase Details
Closed on
Aug 30, 2006
Sold by
Campbell Michael J and Campbell Sandra A
Bought by
Campbell Michael J
Current Estimated Value
Home Financials for this Owner
Home Financials are based on the most recent Mortgage that was taken out on this home.
Original Mortgage
$376,800
Outstanding Balance
$228,249
Interest Rate
6.83%
Mortgage Type
Purchase Money Mortgage
Estimated Equity
$579,931
Purchase Details
Closed on
Mar 4, 1994
Sold by
Johnson Arthur E
Bought by
Campbell Michael J
Purchase Details
Closed on
May 3, 1993
Sold by
Abington Sb
Bought by
Elm Rt
Create a Home Valuation Report for This Property
The Home Valuation Report is an in-depth analysis detailing your home's value as well as a comparison with similar homes in the area
Home Values in the Area
Average Home Value in this Area
Purchase History
| Date | Buyer | Sale Price | Title Company |
|---|---|---|---|
| Campbell Michael J | -- | -- | |
| Campbell Michael J | $153,000 | -- | |
| Elm Rt | $120,000 | -- |
Source: Public Records
Mortgage History
| Date | Status | Borrower | Loan Amount |
|---|---|---|---|
| Open | Campbell Michael J | $376,800 | |
| Previous Owner | Elm Rt | $280,000 | |
| Previous Owner | Elm Rt | $278,000 |
Source: Public Records
Tax History Compared to Growth
Tax History
| Year | Tax Paid | Tax Assessment Tax Assessment Total Assessment is a certain percentage of the fair market value that is determined by local assessors to be the total taxable value of land and additions on the property. | Land | Improvement |
|---|---|---|---|---|
| 2025 | $8,886 | $770,700 | $350,500 | $420,200 |
| 2024 | $8,544 | $758,100 | $350,500 | $407,600 |
| 2023 | $8,110 | $728,700 | $333,800 | $394,900 |
| 2022 | $7,631 | $637,000 | $279,800 | $357,200 |
| 2021 | $7,762 | $639,400 | $279,800 | $359,600 |
| 2020 | $7,499 | $603,300 | $279,800 | $323,500 |
| 2019 | $7,263 | $578,700 | $273,300 | $305,400 |
| 2018 | $6,958 | $521,600 | $259,300 | $262,300 |
| 2017 | $6,578 | $464,200 | $216,100 | $248,100 |
| 2016 | $6,037 | $420,400 | $196,400 | $224,000 |
| 2015 | $5,712 | $391,200 | $178,600 | $212,600 |
| 2014 | $5,002 | $336,600 | $170,100 | $166,500 |
Source: Public Records
Map
Nearby Homes
- 11 Earle St
- 58 Bayfield Rd S
- 297 Billings St
- 85 E Squantum St Unit 10
- 201 Billings St
- 22 Conant Rd
- 143 Arlington St
- 163 Clay St Unit C
- 17 Holmes St Unit 2
- 17 Holmes St Unit 4
- 250 Fayette St
- 25 Hummock Rd
- 22 Newton Ave
- 116 Crabtree Rd
- 100 Grandview Ave Unit 11A
- 111 Warren Ave Unit 1F
- 63 Crabtree Rd
- 175 Quincy Shore Dr Unit B24
- 115 W Squantum St Unit 810
- 212 Quincy Shore Dr
- 169 W Elm Ave
- 165 W Elm Ave
- 161 W Elm Ave
- 172 E Elm Ave
- 168 E Elm Ave
- 168 E Elm Ave Unit 1
- 168 W Elm Ave
- 168 W Elm Ave Unit 1
- 164 E Elm Ave
- 164 E Elm Ave Unit 164
- 164 E Elm Ave Unit 2
- 164 E Elm Ave Unit 1
- 157 W Elm Ave
- 174 W Elm Ave
- 174 W Elm Ave Unit 1
- 162 W Elm Ave
- 162 W Elm Ave Unit 162
- 176 W Elm Ave
- 166 W Elm Ave
- 166 W Elm Ave Unit 2