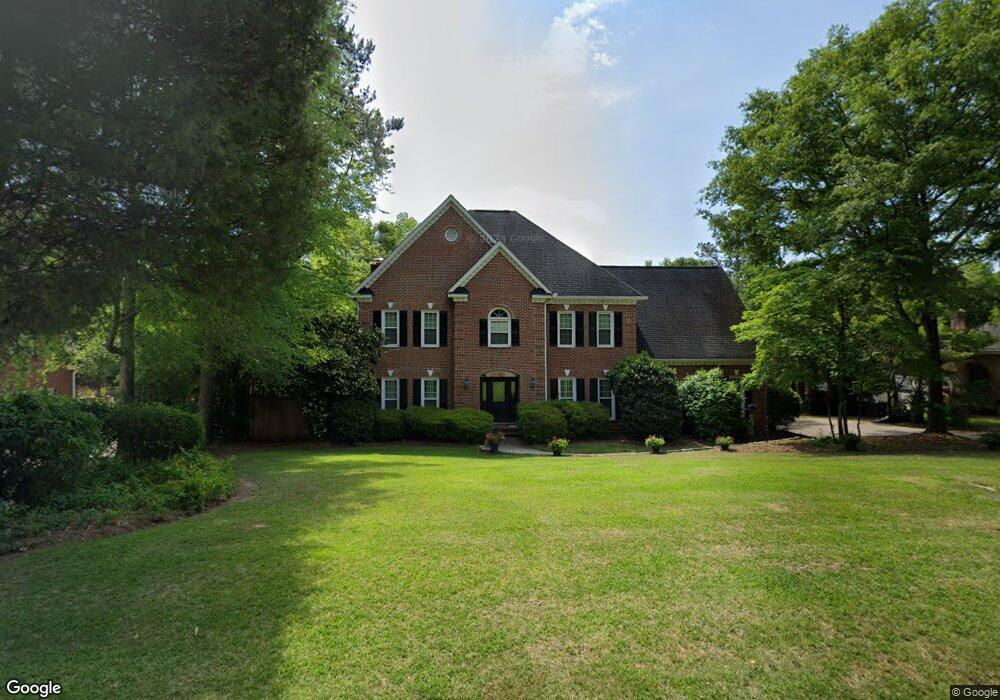
169 Williamstown Way Columbia, SC 29212
Northwest Columbia NeighborhoodEstimated Value: $558,000 - $806,000
6
Beds
5
Baths
5,293
Sq Ft
$127/Sq Ft
Est. Value
About This Home
This home is located at 169 Williamstown Way, Columbia, SC 29212 and is currently estimated at $673,828, approximately $127 per square foot. 169 Williamstown Way is a home located in Lexington County with nearby schools including Irmo Elementary School, Irmo Middle, and Irmo High.
Ownership History
Date
Name
Owned For
Owner Type
Purchase Details
Closed on
Jul 24, 2017
Sold by
Sogaard Franck D and Sogaard Kelly M
Bought by
Thurber Scott C and Thurber Andrea R
Current Estimated Value
Home Financials for this Owner
Home Financials are based on the most recent Mortgage that was taken out on this home.
Original Mortgage
$280,000
Interest Rate
4.25%
Mortgage Type
Adjustable Rate Mortgage/ARM
Purchase Details
Closed on
Jun 1, 2005
Sold by
Jahanbakhsh Baba
Bought by
Sogaard Franck D and Sogaard Kelly M
Home Financials for this Owner
Home Financials are based on the most recent Mortgage that was taken out on this home.
Original Mortgage
$246,320
Interest Rate
5.74%
Mortgage Type
New Conventional
Purchase Details
Closed on
Aug 21, 2002
Sold by
Duncan Rodney J
Bought by
Amer Gen Fin Serv Inc
Create a Home Valuation Report for This Property
The Home Valuation Report is an in-depth analysis detailing your home's value as well as a comparison with similar homes in the area
Home Values in the Area
Average Home Value in this Area
Purchase History
| Date | Buyer | Sale Price | Title Company |
|---|---|---|---|
| Thurber Scott C | $445,000 | None Available | |
| Sogaard Franck D | $307,900 | -- | |
| Amer Gen Fin Serv Inc | -- | -- |
Source: Public Records
Mortgage History
| Date | Status | Borrower | Loan Amount |
|---|---|---|---|
| Previous Owner | Thurber Scott C | $280,000 | |
| Previous Owner | Sogaard Franck D | $246,320 |
Source: Public Records
Tax History Compared to Growth
Tax History
| Year | Tax Paid | Tax Assessment Tax Assessment Total Assessment is a certain percentage of the fair market value that is determined by local assessors to be the total taxable value of land and additions on the property. | Land | Improvement |
|---|---|---|---|---|
| 2024 | $2,737 | $17,886 | $1,600 | $16,286 |
| 2023 | $2,737 | $17,886 | $1,600 | $16,286 |
| 2022 | $2,762 | $17,886 | $1,600 | $16,286 |
| 2020 | $2,892 | $17,886 | $1,600 | $16,286 |
| 2019 | $2,927 | $17,800 | $1,600 | $16,200 |
| 2018 | $2,577 | $17,800 | $1,600 | $16,200 |
| 2017 | $1,841 | $13,047 | $1,600 | $11,447 |
| 2016 | $1,887 | $13,046 | $1,600 | $11,446 |
| 2014 | $1,772 | $12,297 | $2,000 | $10,297 |
| 2013 | -- | $12,300 | $2,000 | $10,300 |
Source: Public Records
Map
Nearby Homes
- 212 Sheringham Rd
- 256 Sheringham Rd
- 132 Systems Ln
- 271 Sheringham Rd
- 279 Sheringham Rd
- 151 Rocky Creek Trail
- 345 Amstar Rd
- 405 Annondale Rd
- 7841 Irmo Dr
- 271 Sandstone Rd
- 300 Wayworth Ct
- 98 Chadford Rd
- 161 Flamingo Rd
- 220 Walnut Ln
- 155 Doverside Dr
- 425 Silver Anchor Dr
- 200 Weeping Cherry Ln
- 124 Torbay Rd
- 113 Tee Ct
- 108 Aspen Ln
- 201 Sheringham Rd
- 163 Williamstown Way
- 221 Systems Ln
- 166 Williamstown Way
- 207 Sheringham Rd
- 215 Systems Ln
- 200 Williamstown Way
- 158 Williamstown Way
- 201 Williamstown Way
- 213 Sheringham Rd
- 208 Williamstown Way
- 151 Williamstown Way
- 154 Williamstown Way
- 216 Systems Ln
- 2 Hillstone Ct
- 207 Williamstown Way
- 231 Systems Ln
- 211 Systems Ln
- 219 Sheringham Rd
- 228 Sheringham Rd