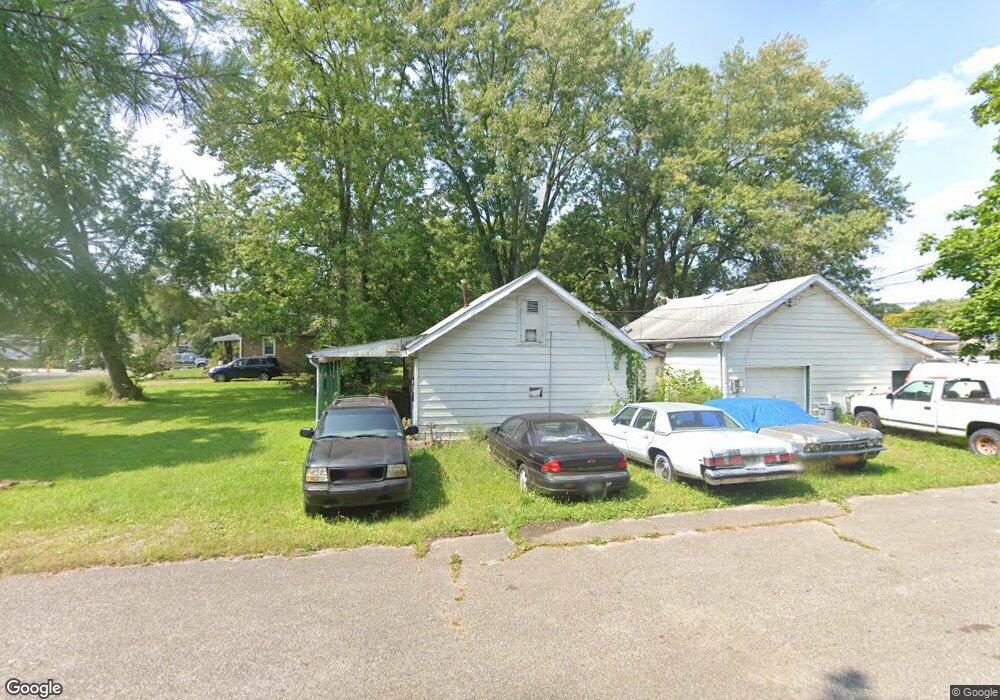
1690 Elmore Ave Columbus, OH 43224
North Linden NeighborhoodEstimated Value: $142,777 - $225,000
2
Beds
1
Bath
1,020
Sq Ft
$186/Sq Ft
Est. Value
About This Home
This home is located at 1690 Elmore Ave, Columbus, OH 43224 and is currently estimated at $189,694, approximately $185 per square foot. 1690 Elmore Ave is a home located in Franklin County with nearby schools including North Linden Elementary School, Medina Middle School, and Mifflin High School.
Ownership History
Date
Name
Owned For
Owner Type
Purchase Details
Closed on
Apr 1, 2009
Sold by
Fairfield National Division Of Park Nati
Bought by
Adams Charles and Adams Susan
Current Estimated Value
Purchase Details
Closed on
May 30, 2008
Sold by
Jmf Properties Llc
Bought by
Fairfield National Division Of Park Nati
Purchase Details
Closed on
Feb 16, 2007
Sold by
Us Bank Na
Bought by
Jmf Properties Llc
Home Financials for this Owner
Home Financials are based on the most recent Mortgage that was taken out on this home.
Original Mortgage
$39,000
Interest Rate
6.28%
Mortgage Type
Purchase Money Mortgage
Purchase Details
Closed on
Jul 21, 2000
Sold by
Segovia Juan D
Bought by
Reed David M and Reed Ronda S
Home Financials for this Owner
Home Financials are based on the most recent Mortgage that was taken out on this home.
Original Mortgage
$50,000
Interest Rate
6.46%
Mortgage Type
Seller Take Back
Purchase Details
Closed on
Aug 14, 1989
Bought by
Segovia Juan D
Create a Home Valuation Report for This Property
The Home Valuation Report is an in-depth analysis detailing your home's value as well as a comparison with similar homes in the area
Home Values in the Area
Average Home Value in this Area
Purchase History
| Date | Buyer | Sale Price | Title Company |
|---|---|---|---|
| Adams Charles | $20,000 | Talon Group | |
| Fairfield National Division Of Park Nati | -- | Talon Group | |
| Jmf Properties Llc | $16,000 | Cornerston | |
| Reed David M | $55,000 | -- | |
| Segovia Juan D | $40,000 | -- |
Source: Public Records
Mortgage History
| Date | Status | Borrower | Loan Amount |
|---|---|---|---|
| Previous Owner | Jmf Properties Llc | $39,000 | |
| Previous Owner | Reed David M | $50,000 |
Source: Public Records
Tax History Compared to Growth
Tax History
| Year | Tax Paid | Tax Assessment Tax Assessment Total Assessment is a certain percentage of the fair market value that is determined by local assessors to be the total taxable value of land and additions on the property. | Land | Improvement |
|---|---|---|---|---|
| 2024 | $2,449 | $39,030 | $8,090 | $30,940 |
| 2023 | $2,425 | $39,030 | $8,090 | $30,940 |
| 2022 | $1,346 | $16,070 | $4,870 | $11,200 |
| 2021 | $1,348 | $16,070 | $4,870 | $11,200 |
| 2020 | $1,349 | $16,070 | $4,870 | $11,200 |
| 2019 | $1,138 | $12,220 | $3,890 | $8,330 |
| 2018 | $740 | $12,220 | $3,890 | $8,330 |
| 2017 | $797 | $12,220 | $3,890 | $8,330 |
| 2016 | $557 | $5,670 | $2,730 | $2,940 |
| 2015 | $494 | $5,670 | $2,730 | $2,940 |
| 2014 | $445 | $5,670 | $2,730 | $2,940 |
| 2013 | $293 | $6,300 | $3,045 | $3,255 |
Source: Public Records
Map
Nearby Homes
- 3591 Bremen St
- 3583 Dresden St
- 3750 Dresden St
- 3498 Bremen St
- 3493 Bremen St
- 1507 Elmore Ave
- 3749 Ganson Dr
- 3469 Dresden St
- 3462 Dresden St
- 1905 Elmore Ave
- 3585 Gerbert Rd
- 3434 Norwood St
- 3491 Ontario St
- 3519 Gerbert Rd
- 3471 Ontario St
- 1496 E Cooke Rd
- 1896 Ormond Ave
- 2015 Melrose Ave
- 1382 Elmore Ave
- 1729 Huy Rd
- 1686 Elmore Ave
- 1674 Elmore Ave
- 1662 Elmore Ave
- 1704 Elmore Ave
- 1910-1916 Elmore Ave
- 3680 Dresden St
- 3701 Dresden St
- 1683 Coronet Dr
- 1683 Coronet Dr Unit 2860
- 1658 Elmore Ave
- 1675 Coronet Dr
- 1652 Elmore Ave
- 3702 Dresden St
- 1667 Coronet Dr
- 0 Elmore Ave
- 1718 Elmore Ave
- 0 Elmore Ave
- 1677 Elmore Ave
- 0 Elmore Ave
- 1713 Coronet Dr