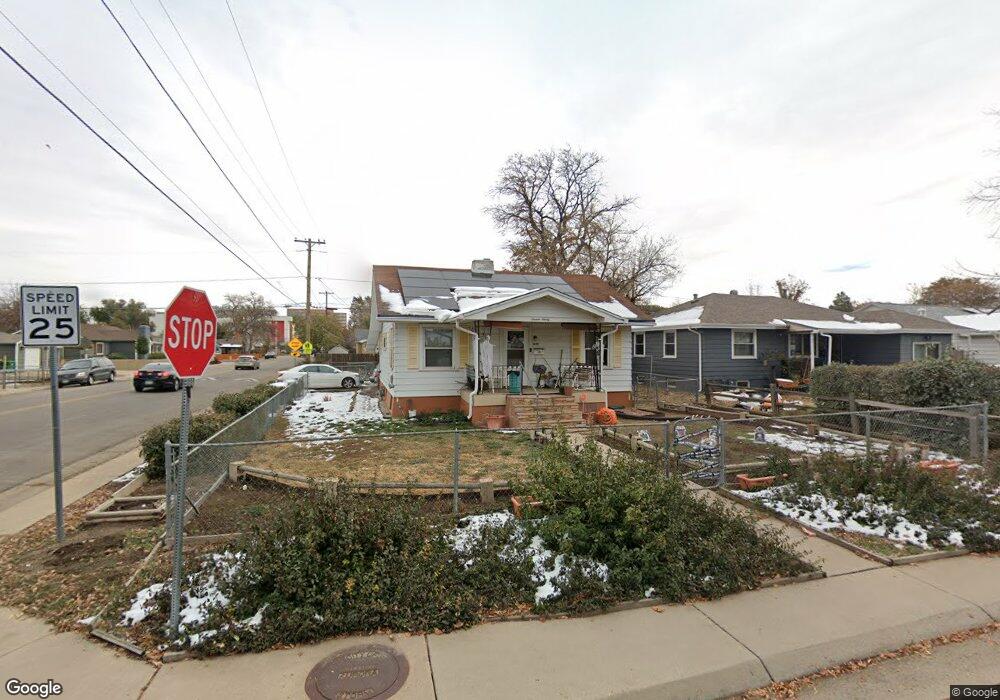
1690 Oakland St Aurora, CO 80010
North Aurora NeighborhoodEstimated Value: $377,000 - $397,348
3
Beds
2
Baths
1,008
Sq Ft
$382/Sq Ft
Est. Value
About This Home
This home is located at 1690 Oakland St, Aurora, CO 80010 and is currently estimated at $385,087, approximately $382 per square foot. 1690 Oakland St is a home located in Adams County with nearby schools including Paris Elementary School, Montview Elementary School, and Lincoln Elementary School.
Ownership History
Date
Name
Owned For
Owner Type
Purchase Details
Closed on
Aug 5, 2005
Sold by
Jp Morgan Chase Bank
Bought by
Lauer Carol and Lauer Darrel
Current Estimated Value
Home Financials for this Owner
Home Financials are based on the most recent Mortgage that was taken out on this home.
Original Mortgage
$112,000
Outstanding Balance
$58,267
Interest Rate
5.51%
Mortgage Type
Fannie Mae Freddie Mac
Estimated Equity
$326,820
Purchase Details
Closed on
May 28, 2002
Sold by
Holloway Glover D
Bought by
Dudley Vivian
Home Financials for this Owner
Home Financials are based on the most recent Mortgage that was taken out on this home.
Original Mortgage
$154,800
Interest Rate
9.99%
Purchase Details
Closed on
Nov 5, 2001
Sold by
Mcdonald Maynard
Bought by
Holloway Glover D
Home Financials for this Owner
Home Financials are based on the most recent Mortgage that was taken out on this home.
Original Mortgage
$111,600
Interest Rate
6.59%
Purchase Details
Closed on
May 21, 1993
Purchase Details
Closed on
Dec 16, 1992
Purchase Details
Closed on
Dec 11, 1992
Create a Home Valuation Report for This Property
The Home Valuation Report is an in-depth analysis detailing your home's value as well as a comparison with similar homes in the area
Home Values in the Area
Average Home Value in this Area
Purchase History
| Date | Buyer | Sale Price | Title Company |
|---|---|---|---|
| Lauer Carol | $140,000 | Fahtco | |
| Dudley Vivian | $172,000 | -- | |
| Holloway Glover D | $124,000 | Title America | |
| -- | $42,000 | -- | |
| -- | -- | -- | |
| -- | -- | -- |
Source: Public Records
Mortgage History
| Date | Status | Borrower | Loan Amount |
|---|---|---|---|
| Open | Lauer Carol | $112,000 | |
| Previous Owner | Dudley Vivian | $154,800 | |
| Previous Owner | Holloway Glover D | $111,600 |
Source: Public Records
Tax History Compared to Growth
Tax History
| Year | Tax Paid | Tax Assessment Tax Assessment Total Assessment is a certain percentage of the fair market value that is determined by local assessors to be the total taxable value of land and additions on the property. | Land | Improvement |
|---|---|---|---|---|
| 2024 | $1,971 | $25,380 | $5,000 | $20,380 |
| 2023 | $2,003 | $29,290 | $5,210 | $24,080 |
| 2022 | $1,733 | $22,200 | $5,350 | $16,850 |
| 2021 | $1,805 | $22,200 | $5,350 | $16,850 |
| 2020 | $1,926 | $23,470 | $5,510 | $17,960 |
| 2019 | $1,922 | $23,470 | $5,510 | $17,960 |
| 2018 | $1,106 | $16,550 | $4,320 | $12,230 |
| 2017 | $983 | $16,550 | $4,320 | $12,230 |
| 2016 | $573 | $10,820 | $2,390 | $8,430 |
| 2015 | $1,111 | $10,820 | $2,390 | $8,430 |
| 2014 | -- | $9,630 | $1,830 | $7,800 |
Source: Public Records
Map
Nearby Homes
- 1772 Oakland St
- 1781 N Oakland St
- 1680 Newark St
- 1616 Newark St
- 1764 Newark St
- 1945 Nome St
- 1772 Moline St
- 1990 Newark St
- 1665 Lima St
- 2040 Moline St
- 1732 Lansing St
- 1592 Lansing St Unit 1-6
- 1673 Lansing St
- 2045 Lima St
- 1902 Kenton St
- 1703 Kenton St
- 11087 Montview Blvd
- 11087 E Montview Blvd
- 1273 Newark St
- 2340 Oswego St
- 1680 Oakland St
- 11809 E 17th Ave
- 11801 E 17th Ave
- 1695 Oswego St
- 1683 Oswego St
- 1701 Oswego St
- 1660 Oakland St
- 1695 Oakland St
- 1671 Oswego St
- 1685 Oakland St
- 11713 E 17th Ave
- 1716 Oakland St
- 1709 Oswego St
- 1659 Oswego St
- 1675 Oakland St
- 1648 Oakland St
- 1647 Oswego St
- 1724 Oakland St
- 1665 Oakland St
- 1717 Oakland St