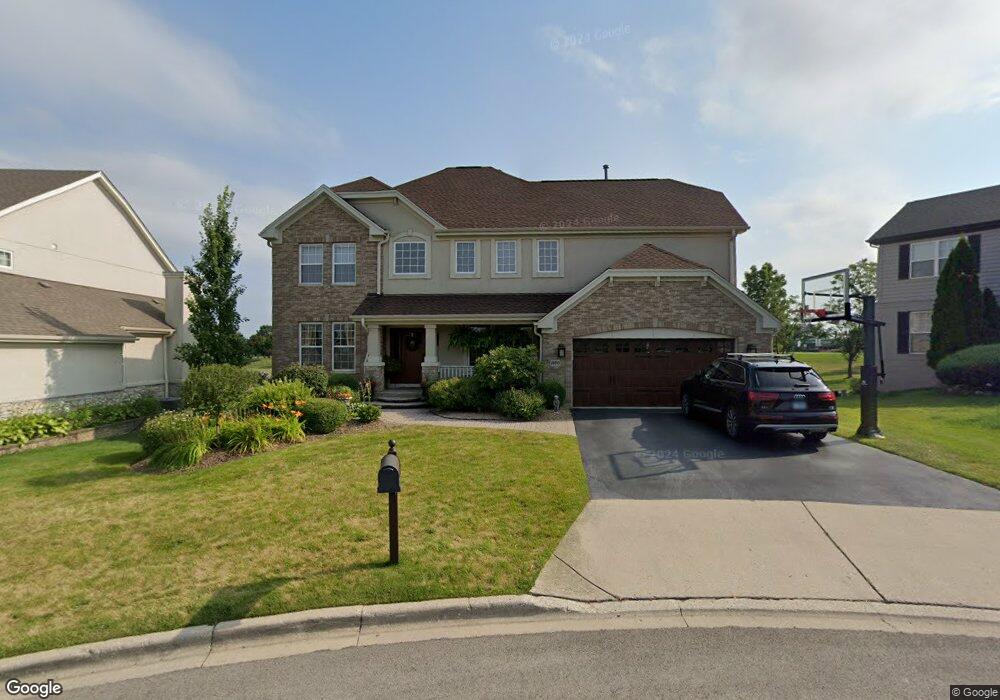
1690 Saint Andrew Dr Vernon Hills, IL 60061
Gregg's Landing NeighborhoodEstimated Value: $824,790 - $881,000
4
Beds
4
Baths
3,016
Sq Ft
$284/Sq Ft
Est. Value
About This Home
This home is located at 1690 Saint Andrew Dr, Vernon Hills, IL 60061 and is currently estimated at $857,198, approximately $284 per square foot. 1690 Saint Andrew Dr is a home located in Lake County with nearby schools including Hawthorn Elementary School North, Hawthorn School Of Dual Language, and Hawthorn Middle School North.
Ownership History
Date
Name
Owned For
Owner Type
Purchase Details
Closed on
Jun 15, 2015
Sold by
Revoca Slavish Jeffrey William
Bought by
The Slavish Family Trust
Current Estimated Value
Purchase Details
Closed on
May 13, 2010
Sold by
Slavish Jeffrey and Slavish Kristin
Bought by
Slavish Jeffrey William and Slavish Kristin Rae
Purchase Details
Closed on
Jun 6, 2006
Sold by
Rossi Robert J
Bought by
Slavish Jeffrey and Slavish Kristin
Home Financials for this Owner
Home Financials are based on the most recent Mortgage that was taken out on this home.
Original Mortgage
$500,000
Outstanding Balance
$296,419
Interest Rate
6.72%
Mortgage Type
Unknown
Estimated Equity
$560,779
Purchase Details
Closed on
Jun 6, 2001
Sold by
Centex Homes
Bought by
Rossi Robert J
Home Financials for this Owner
Home Financials are based on the most recent Mortgage that was taken out on this home.
Original Mortgage
$398,150
Interest Rate
7.14%
Create a Home Valuation Report for This Property
The Home Valuation Report is an in-depth analysis detailing your home's value as well as a comparison with similar homes in the area
Home Values in the Area
Average Home Value in this Area
Purchase History
| Date | Buyer | Sale Price | Title Company |
|---|---|---|---|
| The Slavish Family Trust | -- | None Available | |
| Slavish Jeffrey William | -- | Chicago Title Insurance Co | |
| Slavish Jeffrey | $746,000 | Republic Title Company | |
| Rossi Robert J | $501,000 | -- |
Source: Public Records
Mortgage History
| Date | Status | Borrower | Loan Amount |
|---|---|---|---|
| Open | Slavish Jeffrey | $500,000 | |
| Previous Owner | Rossi Robert J | $398,150 |
Source: Public Records
Tax History Compared to Growth
Tax History
| Year | Tax Paid | Tax Assessment Tax Assessment Total Assessment is a certain percentage of the fair market value that is determined by local assessors to be the total taxable value of land and additions on the property. | Land | Improvement |
|---|---|---|---|---|
| 2024 | $17,919 | $216,604 | $60,450 | $156,154 |
| 2023 | $17,747 | $199,782 | $55,755 | $144,027 |
| 2022 | $17,747 | $196,124 | $53,590 | $142,534 |
| 2021 | $16,990 | $191,902 | $52,436 | $139,466 |
| 2020 | $16,379 | $188,675 | $51,554 | $137,121 |
| 2019 | $15,965 | $186,881 | $51,064 | $135,817 |
| 2018 | $17,814 | $211,288 | $59,188 | $152,100 |
| 2017 | $17,546 | $204,617 | $57,319 | $147,298 |
| 2016 | $16,848 | $194,005 | $54,346 | $139,659 |
| 2015 | $16,346 | $178,430 | $50,796 | $127,634 |
| 2014 | $16,479 | $175,705 | $50,113 | $125,592 |
| 2012 | $15,819 | $177,229 | $50,548 | $126,681 |
Source: Public Records
Map
Nearby Homes
- 1688 Saint Andrew Dr
- 1290 Butterfield Rd
- 1726 Shoal Creek Terrace
- 1434 Maidstone Dr
- 900 S Butterfield Rd
- 1255 Huntington Dr
- 1654 Pebble Beach Way
- 608 Sycamore St
- 31 Washington Blvd Unit 108
- 640 Allanson Rd
- 422 Shadow Creek Dr
- 20 Echo Ct Unit 3
- 1969 Royal Birkdale Dr
- 11 Echo Ct Unit 12
- 15 Echo Ct Unit 8
- 49 N Shaddle Ave
- 4 Parkside Ct Unit 12
- 2245 Hazeltime Dr
- 1028 Cumberland Ct
- 701 Thomas Ct
- 1692 Saint Andrew Dr
- 1686 Saint Andrew Dr
- 1694 Saint Andrew Dr
- 1696 Saint Andrew Dr
- 1680 Saint Andrew Dr
- 1691 Saint Andrew Dr
- 1698 Saint Andrew Dr
- 1699 St Andrew Dr
- 1699 Saint Andrew Dr
- 1683 Saint Andrew Dr
- 1674 Saint Andrew Dr
- 1700 Saint Andrew Dr
- 1700 Saint Andrew Dr
- 1703 Saint Andrew Dr
- 1675 Saint Andrew Dr
- 1675 N St Andrew Dr
- 1666 Saint Andrew Dr
- 1708 Saint Andrew Dr
- 1667 Saint Andrew Dr
- 1709 Saint Andrew Dr