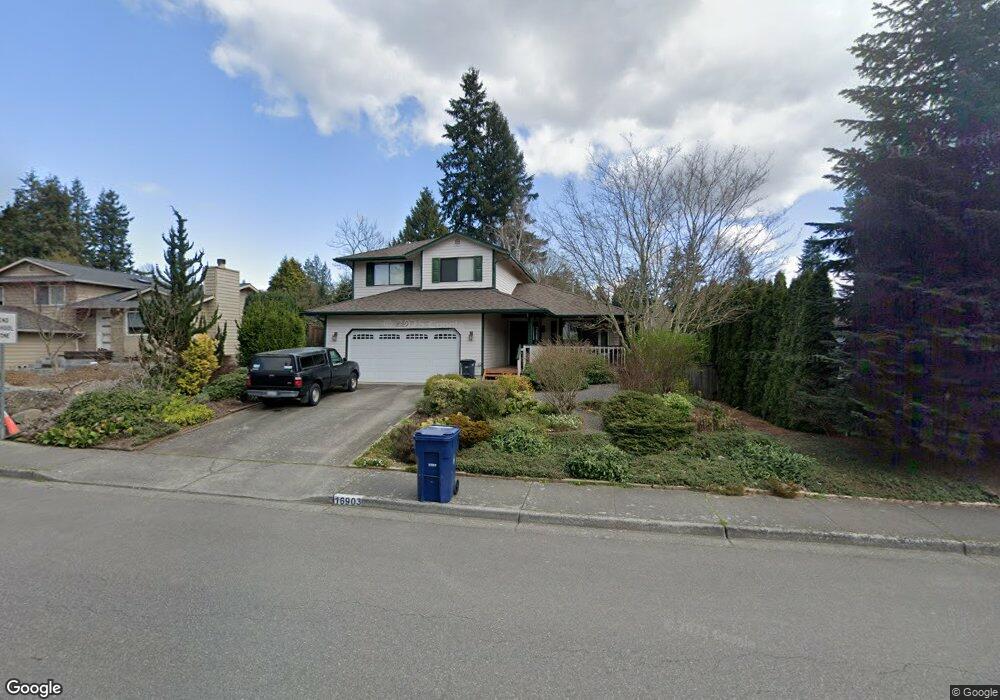
16903 23rd Ave SE Bothell, WA 98012
North Creek NeighborhoodEstimated Value: $768,000 - $852,000
3
Beds
3
Baths
1,630
Sq Ft
$500/Sq Ft
Est. Value
About This Home
This home is located at 16903 23rd Ave SE, Bothell, WA 98012 and is currently estimated at $814,200, approximately $499 per square foot. 16903 23rd Ave SE is a home located in Snohomish County with nearby schools including Woodside Elementary School, Heatherwood Middle School, and Henry M. Jackson High School.
Ownership History
Date
Name
Owned For
Owner Type
Purchase Details
Closed on
Oct 14, 2024
Sold by
Pennings Lawrence D and Pennings Sheryl R
Bought by
Pennings Trust and Pennings
Current Estimated Value
Purchase Details
Closed on
Jul 17, 2003
Sold by
Yamamoto David Takara and Yamamoto Diane Rayray
Bought by
Pennings Lawrence D and Pennings Sheryl R
Home Financials for this Owner
Home Financials are based on the most recent Mortgage that was taken out on this home.
Original Mortgage
$165,000
Interest Rate
5.13%
Mortgage Type
Purchase Money Mortgage
Purchase Details
Closed on
Oct 11, 1993
Sold by
Hoffman Paul S and Hoffman Lida C
Bought by
Yamamoto David Takara and Yamamoto Diane Rayray
Home Financials for this Owner
Home Financials are based on the most recent Mortgage that was taken out on this home.
Original Mortgage
$143,118
Interest Rate
6.94%
Mortgage Type
FHA
Create a Home Valuation Report for This Property
The Home Valuation Report is an in-depth analysis detailing your home's value as well as a comparison with similar homes in the area
Home Values in the Area
Average Home Value in this Area
Purchase History
| Date | Buyer | Sale Price | Title Company |
|---|---|---|---|
| Pennings Trust | $313 | None Listed On Document | |
| Pennings Lawrence D | $238,750 | Commonwealth Land Title | |
| Yamamoto David Takara | $145,000 | Chicago Title Ins Co |
Source: Public Records
Mortgage History
| Date | Status | Borrower | Loan Amount |
|---|---|---|---|
| Previous Owner | Pennings Lawrence D | $165,000 | |
| Previous Owner | Yamamoto David Takara | $143,118 |
Source: Public Records
Tax History
| Year | Tax Paid | Tax Assessment Tax Assessment Total Assessment is a certain percentage of the fair market value that is determined by local assessors to be the total taxable value of land and additions on the property. | Land | Improvement |
|---|---|---|---|---|
| 2026 | $6,787 | $744,400 | $489,600 | $254,800 |
| 2025 | $6,263 | $700,900 | $456,000 | $244,900 |
| 2024 | $6,263 | $649,200 | $412,800 | $236,400 |
| 2023 | $6,600 | $750,700 | $479,800 | $270,900 |
| 2022 | $5,746 | $565,400 | $335,400 | $230,000 |
| 2020 | $5,619 | $464,800 | $265,100 | $199,700 |
| 2019 | $5,241 | $434,700 | $237,200 | $197,500 |
| 2018 | $5,070 | $383,000 | $204,600 | $178,400 |
| 2017 | $4,449 | $337,900 | $172,100 | $165,800 |
| 2016 | $3,924 | $312,700 | $153,900 | $158,800 |
| 2015 | $3,907 | $295,300 | $147,300 | $148,000 |
| 2013 | $3,153 | $209,700 | $106,200 | $103,500 |
Source: Public Records
Map
Nearby Homes
- 2502 166th Place SE
- 16825 17th Ave SE
- 1815 172nd St SE
- 1621 Seattle Hill Rd Unit HH-2
- 1621 Seattle Hill Rd Unit Q3
- 1621 Seattle Hill Rd Unit JJ-3
- 1621 Seattle Hill Rd Unit K4
- 1621 Seattle Hill Rd Unit J5
- 1621 Seattle Hill Rd Unit C4
- 1621 Seattle Hill Rd Unit u-1
- 1516 170th Place SE
- 17529 Brook Blvd
- 19524 16th Ave SE Unit C1
- 1800 Mill Creek Rd Unit 8B
- 1800 Mill Creek Rd Unit 56A
- 1325 Seattle Hill Rd Unit A2
- 1325 Seattle Hill Rd Unit A3
- 1325 Seattle Hill Rd Unit L2
- 17001 31st Dr SE
- 1831 Mill Fern Dr SE Unit 322
- 2317 169th Place SE
- 16829 23rd Ave SE
- 2323 169th Place SE
- 2227 169th Place SE
- 2308 169th Place SE
- 16904 23rd Ave SE
- 2312 168th St SE
- 16817 23rd Ave SE
- 2329 169th Place SE
- 16828 23rd Ave SE
- 2316 169th Place SE
- 16933 23rd Ave SE
- 2322 169th Place SE
- 2226 169th Place SE
- 16911 22nd Ave SE
- 2316 168th St SE
- 2215 169th Place SE
- 16822 23rd Ave SE
- 16903 22nd Ave SE
- 16811 23rd Ave SE
Your Personal Tour Guide
Ask me questions while you tour the home.