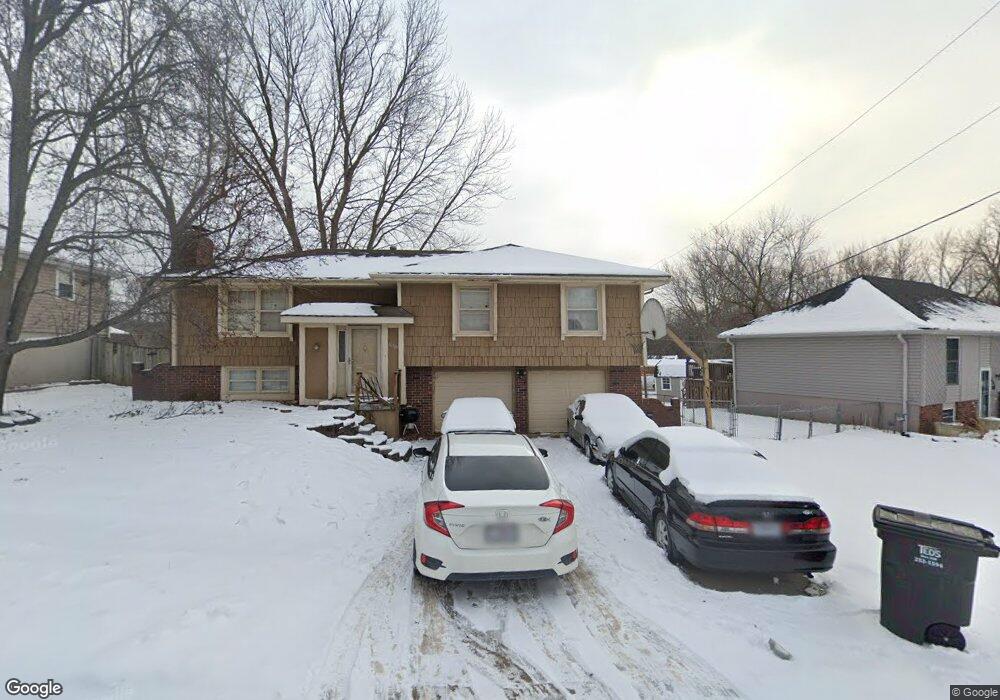
16909 E 4th St S Independence, MO 64056
Spring Branch NeighborhoodEstimated Value: $201,074 - $250,000
3
Beds
2
Baths
1,111
Sq Ft
$207/Sq Ft
Est. Value
About This Home
This home is located at 16909 E 4th St S, Independence, MO 64056 and is currently estimated at $230,269, approximately $207 per square foot. 16909 E 4th St S is a home located in Jackson County with nearby schools including Randall Elementary School, Bridger Middle School, and Bingham Middle School.
Ownership History
Date
Name
Owned For
Owner Type
Purchase Details
Closed on
Nov 10, 2004
Sold by
Braxdale Jennifer S and Ruch Scott M
Bought by
Ruch Scott M and Braxdale Jennifer S
Current Estimated Value
Home Financials for this Owner
Home Financials are based on the most recent Mortgage that was taken out on this home.
Original Mortgage
$103,700
Outstanding Balance
$59,826
Interest Rate
8.2%
Mortgage Type
Purchase Money Mortgage
Estimated Equity
$170,443
Purchase Details
Closed on
Oct 14, 2002
Sold by
Ruch R Michael
Bought by
Braxdale Jennifer
Home Financials for this Owner
Home Financials are based on the most recent Mortgage that was taken out on this home.
Original Mortgage
$91,800
Interest Rate
8.99%
Mortgage Type
Purchase Money Mortgage
Purchase Details
Closed on
Jan 22, 2001
Sold by
Ruch Patricia K
Bought by
Ruch R Michael
Home Financials for this Owner
Home Financials are based on the most recent Mortgage that was taken out on this home.
Original Mortgage
$75,000
Interest Rate
7.43%
Mortgage Type
Purchase Money Mortgage
Create a Home Valuation Report for This Property
The Home Valuation Report is an in-depth analysis detailing your home's value as well as a comparison with similar homes in the area
Home Values in the Area
Average Home Value in this Area
Purchase History
| Date | Buyer | Sale Price | Title Company |
|---|---|---|---|
| Ruch Scott M | -- | Nations Title Agency Inc | |
| Braxdale Jennifer | -- | Realty Title Company | |
| Ruch R Michael | -- | Assured Quality Title Co |
Source: Public Records
Mortgage History
| Date | Status | Borrower | Loan Amount |
|---|---|---|---|
| Open | Ruch Scott M | $103,700 | |
| Closed | Braxdale Jennifer | $91,800 | |
| Previous Owner | Ruch R Michael | $75,000 | |
| Closed | Braxdale Jennifer | $5,400 |
Source: Public Records
Tax History
| Year | Tax Paid | Tax Assessment Tax Assessment Total Assessment is a certain percentage of the fair market value that is determined by local assessors to be the total taxable value of land and additions on the property. | Land | Improvement |
|---|---|---|---|---|
| 2025 | $2,116 | $30,655 | $4,891 | $25,764 |
| 2024 | $2,068 | $30,541 | $2,523 | $28,018 |
| 2023 | $2,068 | $30,541 | $3,325 | $27,216 |
| 2022 | $1,712 | $23,180 | $4,266 | $18,914 |
| 2021 | $1,711 | $23,180 | $4,266 | $18,914 |
| 2020 | $1,640 | $21,586 | $4,266 | $17,320 |
| 2019 | $1,614 | $21,586 | $4,266 | $17,320 |
| 2018 | $1,572 | $20,073 | $3,131 | $16,942 |
| 2016 | $1,548 | $19,570 | $3,327 | $16,243 |
Source: Public Records
Map
Nearby Homes
- 16912 E 4th Terrace S
- 16909 E 3rd St S
- 16901 E 3rd St S
- 216 S Shrank Ave
- 17008 E 2nd St S
- 15707 E 3rd Terrace S
- 320 N M 291 Hwy
- 1820 E Morgan Rd
- 411 N Queen Ridge Ave
- 1749 Sinnott Cir
- 17301 E Cheyenne Dr
- 17293 E Cheyenne Dr
- 1225 Berry Rd
- 300 N Holder Rd
- 710 N Arapaho St
- 1704 Highland Dr
- 1602 S Queen Ridge Way
- 809 N Swope Dr
- 18505 E 5th St N
- 801 N Redwood Dr
- 16913 E 4th St S
- 16905 E 4th St S
- 16912 E 4th St S
- 16917 E 4th St S
- 16904 E 4th St S
- 16901 E 4th St S
- 16920 E 4th St S
- 16908 E 4th St S
- 16908 E 4th Terrace S
- 16921 E 4th St S
- 16916 E 4th Terrace S
- 16924 E 4th St S
- 16905 E 4th Terr S N A
- 16920 E 4th Terrace S
- 16913 E 3rd Terrace S
- 16901 E 4th Terrace S
- 16905 E 4th Terrace S
- 16909 E 4th Terrace S
- 16913 E 4th Terrace S
- 16925 E 4th St S
Your Personal Tour Guide
Ask me questions while you tour the home.