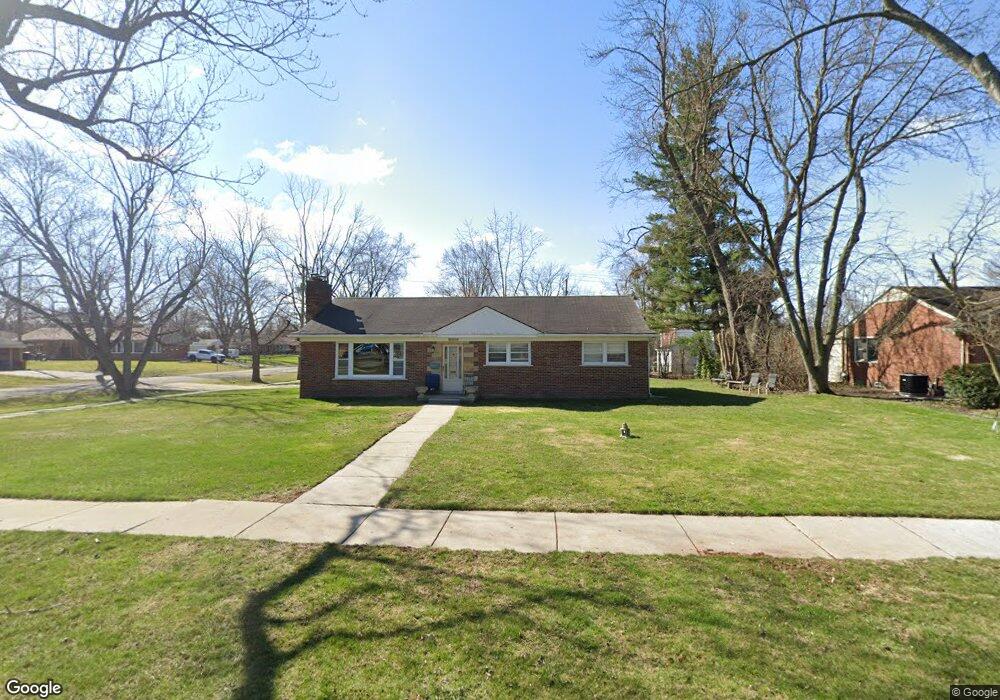
16909 Locherbie Ave Beverly Hills, MI 48025
Estimated Value: $422,929 - $506,000
3
Beds
2
Baths
1,382
Sq Ft
$333/Sq Ft
Est. Value
About This Home
This home is located at 16909 Locherbie Ave, Beverly Hills, MI 48025 and is currently estimated at $460,232, approximately $333 per square foot. 16909 Locherbie Ave is a home located in Oakland County with nearby schools including Beverly Elementary School, Wylie E. Groves High School, and Berkshire Middle School.
Ownership History
Date
Name
Owned For
Owner Type
Purchase Details
Closed on
Aug 20, 2019
Sold by
Gross Michael E and Gross Mary E
Bought by
Gross Michael E and Gross Mary E
Current Estimated Value
Purchase Details
Closed on
Mar 22, 2010
Sold by
Gross Michael E
Bought by
Gross Michael E and Gross Mary
Home Financials for this Owner
Home Financials are based on the most recent Mortgage that was taken out on this home.
Original Mortgage
$137,464
Outstanding Balance
$92,866
Interest Rate
5.37%
Mortgage Type
FHA
Estimated Equity
$367,366
Purchase Details
Closed on
Mar 5, 2010
Sold by
Dewitt Cheryl A and Grace M Bauer Revocable Trust
Bought by
Gross Michael
Home Financials for this Owner
Home Financials are based on the most recent Mortgage that was taken out on this home.
Original Mortgage
$137,464
Outstanding Balance
$92,866
Interest Rate
5.37%
Mortgage Type
FHA
Estimated Equity
$367,366
Purchase Details
Closed on
Dec 20, 1995
Sold by
Bauer Grace M
Bought by
Grace M Bauer Tr
Create a Home Valuation Report for This Property
The Home Valuation Report is an in-depth analysis detailing your home's value as well as a comparison with similar homes in the area
Home Values in the Area
Average Home Value in this Area
Purchase History
| Date | Buyer | Sale Price | Title Company |
|---|---|---|---|
| Gross Michael E | -- | None Available | |
| Gross Michael E | -- | None Available | |
| Gross Michael E | -- | None Available | |
| Gross Michael | $140,000 | C E M Title Agency Inc | |
| Grace M Bauer Tr | -- | -- |
Source: Public Records
Mortgage History
| Date | Status | Borrower | Loan Amount |
|---|---|---|---|
| Open | Gross Michael | $137,464 |
Source: Public Records
Tax History Compared to Growth
Tax History
| Year | Tax Paid | Tax Assessment Tax Assessment Total Assessment is a certain percentage of the fair market value that is determined by local assessors to be the total taxable value of land and additions on the property. | Land | Improvement |
|---|---|---|---|---|
| 2024 | $3,720 | $171,770 | $0 | $0 |
| 2023 | $3,569 | $158,540 | $0 | $0 |
| 2022 | $3,871 | $150,310 | $0 | $0 |
| 2021 | $3,903 | $143,970 | $0 | $0 |
| 2020 | $3,269 | $138,390 | $0 | $0 |
| 2019 | $2,583 | $132,990 | $0 | $0 |
| 2018 | $3,777 | $124,880 | $0 | $0 |
| 2017 | $3,756 | $124,880 | $0 | $0 |
| 2016 | $3,765 | $116,400 | $0 | $0 |
| 2015 | -- | $108,240 | $0 | $0 |
| 2014 | -- | $96,050 | $0 | $0 |
| 2011 | -- | $82,910 | $0 | $0 |
Source: Public Records
Map
Nearby Homes
- 16950 Kinross Ave
- 16281 Buckingham Ave
- 16207 Wetherby St
- 16946 Reedmere Ave
- 16141 Reedmere Ave
- 16276 Amherst Ave
- 16991 Kirkshire Ave
- 16975 W Fourteen Mile Rd
- 1978 Henrietta St
- 251 E 14 Mile Rd
- 150 Bird Ave Unit 20
- 15858 Kirkshire Ave
- 1886 Henrietta St
- 31160 E Rutland St
- 15590 Buckingham Ave
- 15654 Kirkshire Ave
- 4419 Beverly Ct
- 31607 Auburn Dr
- 17058 W 13 Mile Rd
- 1748 Stanley Blvd
- 16925 Locherbie Ave
- 16908 Beechwood Ave
- 16935 Locherbie Ave
- 16934 Beechwood Ave
- 16395 Locherbie Ave
- 16938 Beechwood Ave
- 16926 Locherbie Ave
- 16910 Locherbie Ave
- 16951 Locherbie Ave
- 16375 Locherbie Ave
- 16948 Beechwood Ave
- 16940 Locherbie Ave
- 16961 Locherbie Ave
- 16360 Beechwood Ave
- 16950 Locherbie Ave
- 16295 Locherbie Ave
- 16320 Locherbie Ave
- 16296 Beechwood Ave
- 16962 Locherbie Ave
- 16975 Locherbie Ave