Estimated Value: $155,000 - $171,000
3
Beds
1
Bath
1,008
Sq Ft
$164/Sq Ft
Est. Value
About This Home
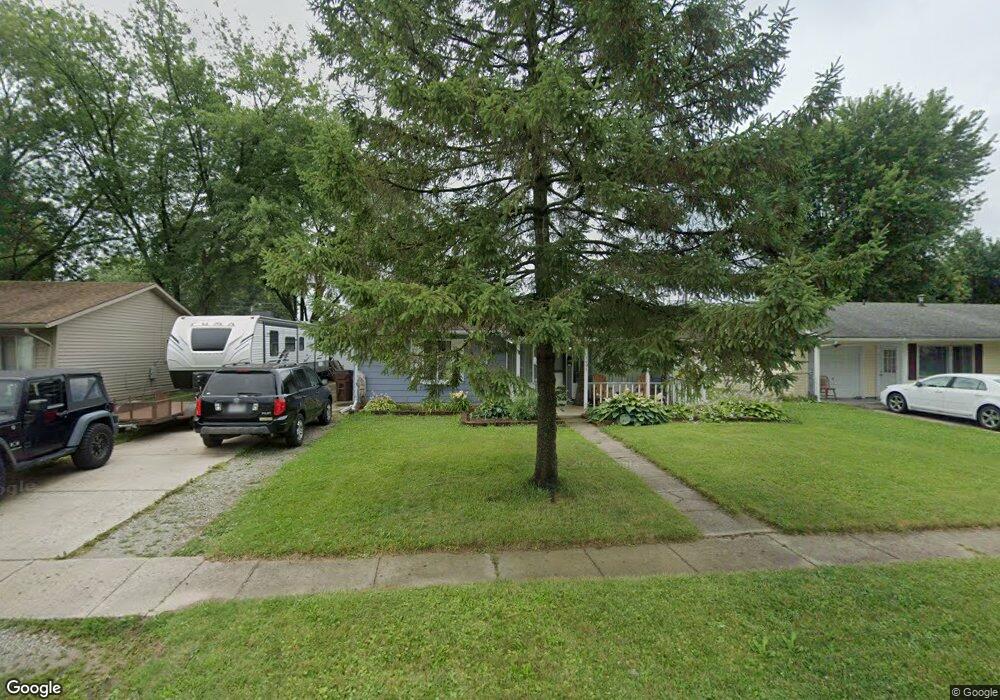
This home is located at 1691 Kylemore Dr, Xenia, OH 45385 and is currently estimated at $165,137, approximately $163 per square foot. 1691 Kylemore Dr is a home located in Greene County with nearby schools including Xenia High School, Summit Academy Community School for Alternative Learners - Xenia, and Legacy Christian Academy.
Ownership History
Date
Name
Owned For
Owner Type
Purchase Details
Closed on
Aug 6, 2002
Sold by
Nunn Robert E and Nunn Regina
Bought by
Grimm Donald R
Current Estimated Value
Home Financials for this Owner
Home Financials are based on the most recent Mortgage that was taken out on this home.
Original Mortgage
$62,300
Outstanding Balance
$33,078
Interest Rate
10.24%
Estimated Equity
$132,059
Purchase Details
Closed on
Jun 30, 1998
Sold by
Nunn Rebecca R
Bought by
Nunn Robert E
Home Financials for this Owner
Home Financials are based on the most recent Mortgage that was taken out on this home.
Original Mortgage
$72,240
Interest Rate
7.17%
Mortgage Type
VA
Purchase Details
Closed on
May 29, 1996
Sold by
Seedle Jack D
Bought by
Nunn Robert E and Nunn R
Home Financials for this Owner
Home Financials are based on the most recent Mortgage that was taken out on this home.
Original Mortgage
$68,238
Interest Rate
7.99%
Mortgage Type
VA
Create a Home Valuation Report for This Property
The Home Valuation Report is an in-depth analysis detailing your home's value as well as a comparison with similar homes in the area
Home Values in the Area
Average Home Value in this Area
Purchase History
| Date | Buyer | Sale Price | Title Company |
|---|---|---|---|
| Grimm Donald R | -- | -- | |
| Nunn Robert E | -- | -- | |
| Nunn Robert E | $66,900 | -- |
Source: Public Records
Mortgage History
| Date | Status | Borrower | Loan Amount |
|---|---|---|---|
| Open | Grimm Donald R | $62,300 | |
| Previous Owner | Nunn Robert E | $72,240 | |
| Previous Owner | Nunn Robert E | $68,238 | |
| Closed | Grimm Donald R | $15,550 |
Source: Public Records
Tax History Compared to Growth
Tax History
| Year | Tax Paid | Tax Assessment Tax Assessment Total Assessment is a certain percentage of the fair market value that is determined by local assessors to be the total taxable value of land and additions on the property. | Land | Improvement |
|---|---|---|---|---|
| 2024 | $1,633 | $38,160 | $9,590 | $28,570 |
| 2023 | $1,633 | $38,160 | $9,590 | $28,570 |
| 2022 | $1,356 | $27,030 | $6,850 | $20,180 |
| 2021 | $1,374 | $27,030 | $6,850 | $20,180 |
| 2020 | $1,317 | $27,030 | $6,850 | $20,180 |
| 2019 | $1,050 | $20,290 | $4,640 | $15,650 |
| 2018 | $1,054 | $20,290 | $4,640 | $15,650 |
| 2017 | $1,024 | $20,290 | $4,640 | $15,650 |
| 2016 | $1,004 | $18,960 | $4,640 | $14,320 |
| 2015 | $1,006 | $18,960 | $4,640 | $14,320 |
| 2014 | $964 | $18,960 | $4,640 | $14,320 |
Source: Public Records
Map
Nearby Homes
- 1144 Rockwell Dr
- 1568 Cheyenne Dr
- 1342 Kylemore Dr
- 121 S Progress Dr
- 1391 June Dr
- 1283 June Dr
- 1233 June Dr
- 1223 June Dr
- 1618 Navajo Dr
- 1653 Seneca Dr
- 2758 Wyoming Dr
- 1351 Omard Dr
- 1208 Bellbrook Ave
- 1272 Bellbrook Ave
- 1778 Arapaho Dr
- 343 Sheelin Rd
- 219 Kansas Dr
- 1769 Gayhart Dr
- 1829 Gayhart Dr
- 414 Whisper Ln
- 1677 Kylemore Dr
- 1703 Kylemore Dr
- 1665 Kylemore Dr
- 1676 Drake Dr
- 1700 Drake Dr
- 401 Beatty Dr
- 419 Beatty Dr
- 1684 Kylemore Dr
- 1662 Drake Dr
- 1696 Kylemore Dr
- 1653 Kylemore Dr
- 431 Beatty Dr
- 375 Beatty Dr
- 1658 Kylemore Dr
- 1650 Drake Dr
- 1641 Kylemore Dr
- 1644 Kylemore Dr
- 363 Beatty Dr
- 1638 Drake Dr
- 313 Ridgebury Dr