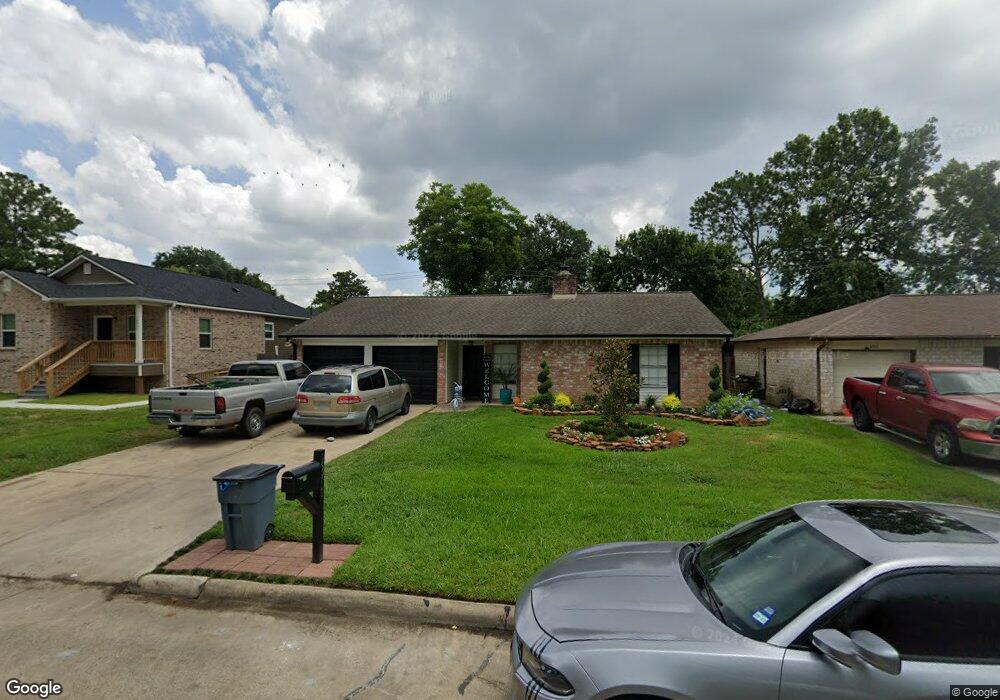
16911 Townes Rd Friendswood, TX 77546
Estimated Value: $220,000 - $241,000
3
Beds
2
Baths
1,239
Sq Ft
$184/Sq Ft
Est. Value
About This Home
This home is located at 16911 Townes Rd, Friendswood, TX 77546 and is currently estimated at $227,362, approximately $183 per square foot. 16911 Townes Rd is a home located in Harris County with nearby schools including Wedgewood Elementary School, Brookside Intermediate School, and Clear Brook High School.
Ownership History
Date
Name
Owned For
Owner Type
Purchase Details
Closed on
Sep 1, 2020
Sold by
Lue Jonathan and Lue Daniel
Bought by
Vasquez Estephanie and Rios Wreybin Fabricio
Current Estimated Value
Home Financials for this Owner
Home Financials are based on the most recent Mortgage that was taken out on this home.
Original Mortgage
$150,000
Outstanding Balance
$133,115
Interest Rate
2.9%
Mortgage Type
Seller Take Back
Estimated Equity
$94,247
Purchase Details
Closed on
Aug 18, 2009
Sold by
Dorman Elsie Lee
Bought by
Lue Jonathan and Lue Daniel
Purchase Details
Closed on
Nov 28, 2007
Sold by
Griffin Andrew Wilson
Bought by
Dorman Elsie Lee
Purchase Details
Closed on
Jan 30, 2007
Sold by
Dorman Elsie Lee
Bought by
Griffin Andrew Wilson
Create a Home Valuation Report for This Property
The Home Valuation Report is an in-depth analysis detailing your home's value as well as a comparison with similar homes in the area
Home Values in the Area
Average Home Value in this Area
Purchase History
| Date | Buyer | Sale Price | Title Company |
|---|---|---|---|
| Vasquez Estephanie | -- | First American Title | |
| Lue Jonathan | -- | Commonwealth | |
| Dorman Elsie Lee | -- | None Available | |
| Griffin Andrew Wilson | -- | None Available |
Source: Public Records
Mortgage History
| Date | Status | Borrower | Loan Amount |
|---|---|---|---|
| Open | Vasquez Estephanie | $150,000 |
Source: Public Records
Tax History Compared to Growth
Tax History
| Year | Tax Paid | Tax Assessment Tax Assessment Total Assessment is a certain percentage of the fair market value that is determined by local assessors to be the total taxable value of land and additions on the property. | Land | Improvement |
|---|---|---|---|---|
| 2025 | $3,514 | $222,928 | $58,568 | $164,360 |
| 2024 | $3,514 | $204,484 | $58,568 | $145,916 |
| 2023 | $3,514 | $208,899 | $58,568 | $150,331 |
| 2022 | $3,770 | $189,495 | $58,568 | $130,927 |
| 2021 | $3,613 | $160,357 | $47,840 | $112,517 |
| 2020 | $3,458 | $141,247 | $33,676 | $107,571 |
| 2019 | $3,236 | $126,015 | $25,800 | $100,215 |
| 2018 | $586 | $92,202 | $27,743 | $64,459 |
| 2017 | $2,943 | $114,000 | $27,743 | $86,257 |
| 2016 | $3,152 | $122,115 | $27,743 | $94,372 |
| 2015 | $2,570 | $112,253 | $27,743 | $84,510 |
| 2014 | $2,570 | $97,800 | $23,119 | $74,681 |
Source: Public Records
Map
Nearby Homes
- 4015 Ravine Dr
- 16903 Paint Rock Rd
- 16907 Tibet Rd
- 17003 Tibet Rd
- 16703 Hibiscus Ln
- 16926 Blackhawk Blvd
- 4315 Ravine Dr
- 3836 Laura Leigh Dr
- 3878 Laura Leigh Dr
- 16607 David Glen Dr
- 16823 Bougainvilla Ln
- 16811 Bougainvilla Ln
- 4311 Townes Forest Rd
- 4430 Peridot Ln
- 4426 Saffron Ln
- 16510 Blackhawk Blvd
- 16922 Echo Harbor
- 16923 Lighthouse View Dr
- 16915 Lighthouse View Dr
- 5498 Apple Blossom Ln
- 16915 Townes Rd
- 16907 Townes Rd
- 16910 David Glen Dr
- 16919 Townes Rd
- 16914 David Glen Dr
- 16906 David Glen Dr
- 16918 David Glen Dr
- 16902 David Glen Dr
- 16823 Townes Rd
- 16923 Townes Rd
- 16922 Townes Rd
- 16918 Townes Rd
- 16926 Townes Rd
- 16910 Townes Rd
- 16822 David Glen Dr
- 16922 David Glen Dr
- 16819 Townes Rd
- 16930 Townes Rd
- 16927 Townes Rd
- 16906 Townes Rd