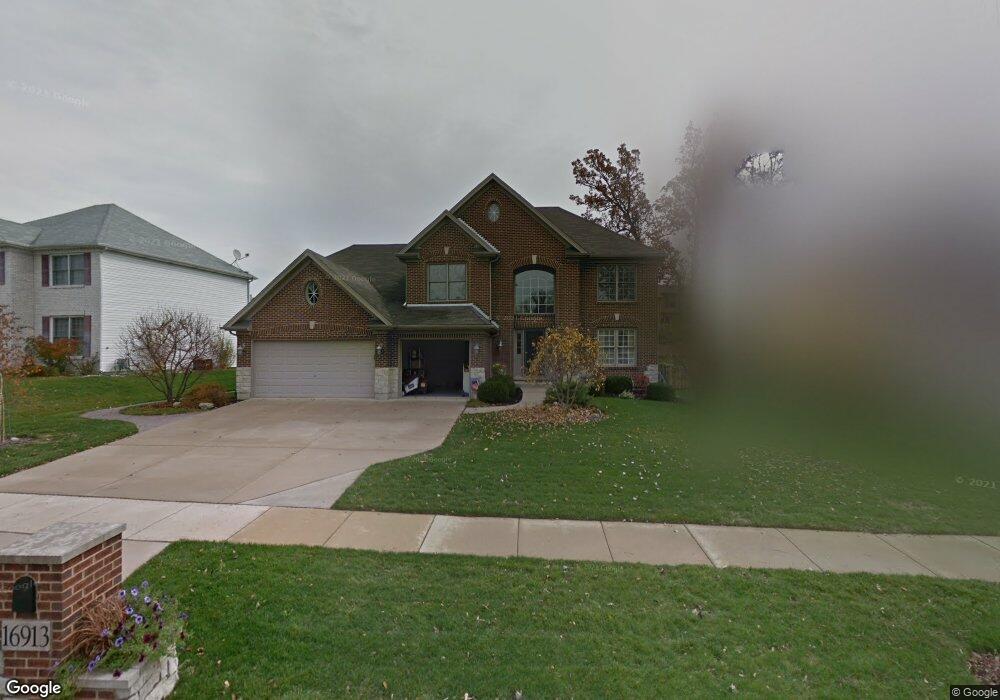
16913 Arbor Creek Dr Unit 2 Plainfield, IL 60586
East Plainfield NeighborhoodEstimated Value: $499,618 - $748,000
5
Beds
3
Baths
2,998
Sq Ft
$201/Sq Ft
Est. Value
About This Home
This home is located at 16913 Arbor Creek Dr Unit 2, Plainfield, IL 60586 and is currently estimated at $602,873, approximately $201 per square foot. 16913 Arbor Creek Dr Unit 2 is a home located in Will County with nearby schools including River View Elementary School, Timber Ridge Middle School, and Plainfield Central High School.
Ownership History
Date
Name
Owned For
Owner Type
Purchase Details
Closed on
Apr 7, 2022
Sold by
Burkemper Dwain L and Burkemper Linda
Bought by
Burkemper Dwain L and Burkemper Linda
Current Estimated Value
Purchase Details
Closed on
Apr 8, 2011
Sold by
Hogle Julia L
Bought by
Burkemper Dwain L and Burkemper Linda
Purchase Details
Closed on
Mar 22, 2006
Sold by
Hartge David N and Hartge Tracy L
Bought by
Hogle Billie E and Hogle Julia L
Purchase Details
Closed on
Aug 28, 2003
Sold by
Midwest Bank & Trust Co
Bought by
Hartge Davin N and Hartge Tracy L
Home Financials for this Owner
Home Financials are based on the most recent Mortgage that was taken out on this home.
Original Mortgage
$314,697
Interest Rate
6.33%
Mortgage Type
Purchase Money Mortgage
Purchase Details
Closed on
Feb 25, 2003
Sold by
The Krughoff Co
Bought by
Midwest Bank & Trust Co and Trust #96-6-7087
Create a Home Valuation Report for This Property
The Home Valuation Report is an in-depth analysis detailing your home's value as well as a comparison with similar homes in the area
Home Values in the Area
Average Home Value in this Area
Purchase History
| Date | Buyer | Sale Price | Title Company |
|---|---|---|---|
| Burkemper Dwain L | -- | None Listed On Document | |
| Burkemper Dwain L | $280,000 | Fidelity National Title | |
| Hogle Billie E | $374,000 | Wheatland Title | |
| Hartge Davin N | $331,500 | -- | |
| Midwest Bank & Trust Co | -- | Ticor Title |
Source: Public Records
Mortgage History
| Date | Status | Borrower | Loan Amount |
|---|---|---|---|
| Previous Owner | Hartge Davin N | $314,697 |
Source: Public Records
Tax History Compared to Growth
Tax History
| Year | Tax Paid | Tax Assessment Tax Assessment Total Assessment is a certain percentage of the fair market value that is determined by local assessors to be the total taxable value of land and additions on the property. | Land | Improvement |
|---|---|---|---|---|
| 2024 | $10,528 | $158,809 | $29,879 | $128,930 |
| 2023 | $10,528 | $143,433 | $26,986 | $116,447 |
| 2022 | $6,815 | $137,576 | $25,884 | $111,692 |
| 2021 | $6,912 | $128,576 | $24,191 | $104,385 |
| 2020 | $7,024 | $124,928 | $23,505 | $101,423 |
| 2019 | $7,131 | $119,035 | $22,396 | $96,639 |
| 2018 | $7,278 | $111,839 | $21,042 | $90,797 |
| 2017 | $7,445 | $106,280 | $19,996 | $86,284 |
| 2016 | $8,675 | $101,364 | $19,071 | $82,293 |
| 2015 | $7,864 | $94,954 | $17,865 | $77,089 |
| 2014 | $7,864 | $88,060 | $17,234 | $70,826 |
| 2013 | $7,864 | $88,060 | $17,234 | $70,826 |
Source: Public Records
Map
Nearby Homes
- 23033 Ironwood Dr Unit 3
- 3806 Brenton Dr
- 3812 Hennepin Dr
- 16741 Hazelwood Dr
- 3712 Hennepin Dr
- 4022 Hennepin Dr Unit 171
- 3540 Woodside Ct
- 16517 Spangler Rd
- 2421 Lockner Blvd
- 3032 Woodside Dr Unit 65
- 23213 W Kennebec Dr
- 23314 W Leach Dr
- 3419 Lake Side Cir
- 2718 Lake Side Cir
- 2350 Woodhill Ct
- 2336 Woodhill Ct
- 23736 Dayfield Ct
- 23311 W Peterson Dr
- 2731 Old Woods Trail Unit 9C
- 23105 W Oak St
- 16921 Arbor Creek Dr
- 16905 Arbor Creek Dr
- 16922 Hazelwood Dr
- 16929 Arbor Creek Dr Unit 2
- 16930 Hazelwood Dr
- 16863 Arbor Creek Dr
- 16914 Arbor Creek Dr
- 16906 Arbor Creek Dr Unit 2
- 16914 Hazelwood Dr
- 16938 Hazelwood Dr
- 16922 Arbor Creek Dr
- 16937 Arbor Creek Dr
- 16855 Arbor Creek Dr
- 16906 Hazelwood Dr Unit 1
- 16864 Arbor Creek Dr
- 16930 Arbor Creek Dr
- 16946 Hazelwood Dr
- 16856 Arbor Creek Dr
- 16945 Arbor Creek Dr
- 16847 Arbor Creek Dr