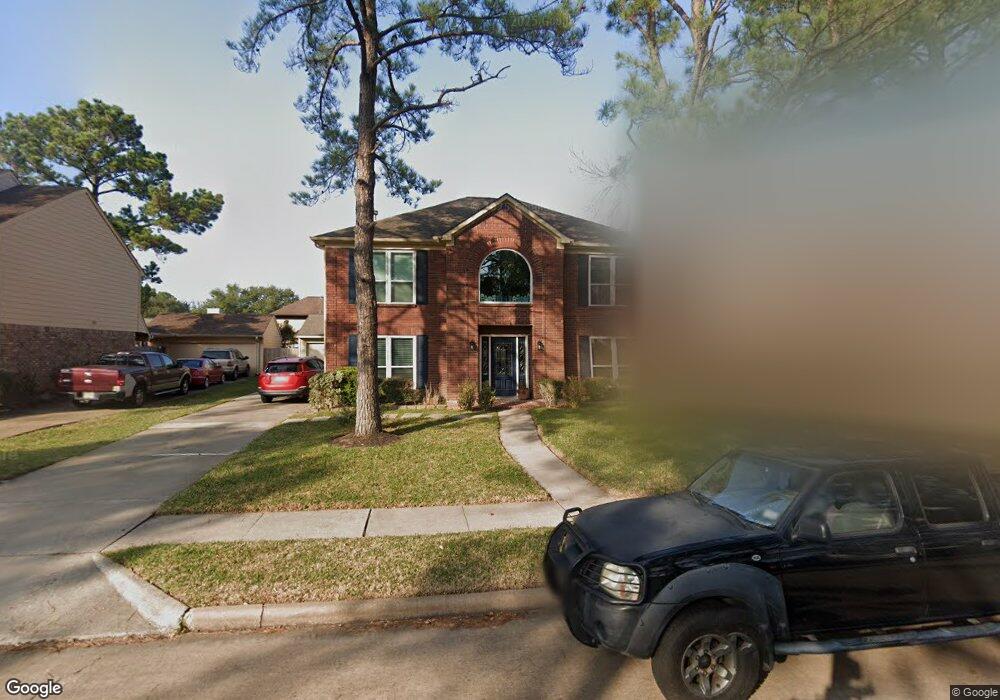
16914 Poplar Hill St Houston, TX 77095
Copperfield NeighborhoodEstimated Value: $326,835 - $355,000
4
Beds
3
Baths
2,348
Sq Ft
$146/Sq Ft
Est. Value
About This Home
This home is located at 16914 Poplar Hill St, Houston, TX 77095 and is currently estimated at $343,209, approximately $146 per square foot. 16914 Poplar Hill St is a home located in Harris County with nearby schools including Lowery Elementary School, Aragon Middle School, and Langham Creek High School.
Ownership History
Date
Name
Owned For
Owner Type
Purchase Details
Closed on
Nov 17, 2016
Sold by
Plazas Luis A and Anez Irais Josefina Plazas
Bought by
Plazas Juis A and Anez Irais Josefina Plazas
Current Estimated Value
Purchase Details
Closed on
Nov 16, 2005
Sold by
Themigroup Inc
Bought by
Plazas Luis A and Anez Irais J
Home Financials for this Owner
Home Financials are based on the most recent Mortgage that was taken out on this home.
Original Mortgage
$104,400
Interest Rate
6.1%
Mortgage Type
Fannie Mae Freddie Mac
Purchase Details
Closed on
Nov 4, 2005
Sold by
Langson Sidney B and Langson Billie E
Bought by
Themigroup Inc
Home Financials for this Owner
Home Financials are based on the most recent Mortgage that was taken out on this home.
Original Mortgage
$104,400
Interest Rate
6.1%
Mortgage Type
Fannie Mae Freddie Mac
Create a Home Valuation Report for This Property
The Home Valuation Report is an in-depth analysis detailing your home's value as well as a comparison with similar homes in the area
Home Values in the Area
Average Home Value in this Area
Purchase History
| Date | Buyer | Sale Price | Title Company |
|---|---|---|---|
| Plazas Juis A | -- | None Available | |
| Plazas Luis A | -- | Chicago Title | |
| Themigroup Inc | -- | Chicago Title |
Source: Public Records
Mortgage History
| Date | Status | Borrower | Loan Amount |
|---|---|---|---|
| Closed | Plazas Luis A | $26,100 | |
| Previous Owner | Plazas Luis A | $104,400 | |
| Previous Owner | Themigroup Inc | $26,100 |
Source: Public Records
Tax History Compared to Growth
Tax History
| Year | Tax Paid | Tax Assessment Tax Assessment Total Assessment is a certain percentage of the fair market value that is determined by local assessors to be the total taxable value of land and additions on the property. | Land | Improvement |
|---|---|---|---|---|
| 2025 | $4,713 | $303,724 | $74,556 | $229,168 |
| 2024 | $4,713 | $305,282 | $64,831 | $240,451 |
| 2023 | $4,713 | $316,817 | $64,831 | $251,986 |
| 2022 | $6,219 | $288,675 | $46,192 | $242,483 |
| 2021 | $5,975 | $235,522 | $46,192 | $189,330 |
| 2020 | $5,959 | $227,691 | $38,494 | $189,197 |
| 2019 | $5,798 | $221,695 | $38,494 | $183,201 |
| 2018 | $1,886 | $195,000 | $38,494 | $156,506 |
| 2017 | $5,093 | $206,867 | $38,494 | $168,373 |
| 2016 | $4,630 | $206,867 | $38,494 | $168,373 |
| 2015 | $2,182 | $195,456 | $38,494 | $156,962 |
| 2014 | $2,182 | $178,397 | $33,631 | $144,766 |
Source: Public Records
Map
Nearby Homes
- 17010 Poplar Hill St
- 16911 Shady Square Ct
- 7539 Wildwood Brook Ct
- 7510 Dogwood Falls Rd
- 7607 Plumtree Forest Cir
- 16734 Pebbleglen Dr
- 7306 Bubbling Brooks Ln
- 7311 Barton Oaks Dr
- 7614 Mccormick Mill Ct
- 16502 Rainbow Lake Rd
- 17214 Palm Falls Ct
- 17222 Crown Meadow Ct
- 7622 Mccormick Mill Ct
- 7719 Woodlett Ct
- 7519 Sunlight Ln
- 16902 Terrace Park Dr
- 7626 Almond Springs Dr
- 17206 Haley Falls Ln
- 7254 Sonnet Glen Ln
- 16535 Oat Mill Dr
- 16918 Poplar Hill St
- 16910 Poplar Hill St
- 16919 Country Bridge Rd
- 16915 Country Bridge Rd
- 16922 Poplar Hill St
- 16906 Poplar Hill St
- 16923 Country Bridge Rd
- 16911 Country Bridge Rd
- 16911 Poplar Hill St
- 16915 Poplar Hill St
- 17003 Country Bridge Rd
- 16907 Poplar Hill St
- 16919 Poplar Hill St
- 16926 Poplar Hill St
- 16902 Poplar Hill St
- 16903 Poplar Hill St
- 17007 Country Bridge Rd
- 16903 Country Bridge Rd
- 7602 Ivy Path Ct
- 17002 Poplar Hill St