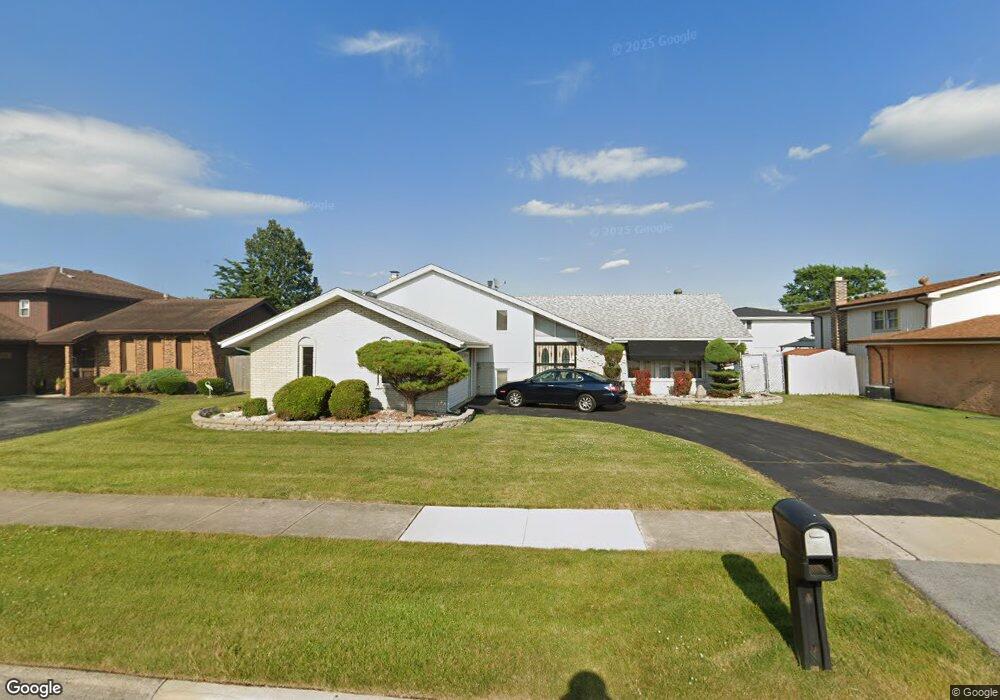
16915 Merrill Ave South Holland, IL 60473
Estimated Value: $278,000 - $312,000
3
Beds
3
Baths
1,606
Sq Ft
$181/Sq Ft
Est. Value
About This Home
This home is located at 16915 Merrill Ave, South Holland, IL 60473 and is currently estimated at $290,991, approximately $181 per square foot. 16915 Merrill Ave is a home located in Cook County with nearby schools including Greenwood Elementary School, Mckinley Elementary School, and Mckinley Jr High School.
Ownership History
Date
Name
Owned For
Owner Type
Purchase Details
Closed on
Nov 11, 2011
Sold by
Smith Tyson R
Bought by
Standard Bank & Trust Company and Trust #21147
Current Estimated Value
Home Financials for this Owner
Home Financials are based on the most recent Mortgage that was taken out on this home.
Original Mortgage
$115,983
Interest Rate
4.4%
Mortgage Type
FHA
Purchase Details
Closed on
Oct 13, 2011
Sold by
Mcrae James E and Mcrae Mary E
Bought by
Smith Tyson R
Home Financials for this Owner
Home Financials are based on the most recent Mortgage that was taken out on this home.
Original Mortgage
$115,983
Interest Rate
4.4%
Mortgage Type
FHA
Purchase Details
Closed on
Jun 12, 1996
Sold by
South Holland Trust & Svgs Bank
Bought by
Mcrae James E and Mcrae Mary E
Home Financials for this Owner
Home Financials are based on the most recent Mortgage that was taken out on this home.
Original Mortgage
$138,720
Interest Rate
8.09%
Create a Home Valuation Report for This Property
The Home Valuation Report is an in-depth analysis detailing your home's value as well as a comparison with similar homes in the area
Home Values in the Area
Average Home Value in this Area
Purchase History
| Date | Buyer | Sale Price | Title Company |
|---|---|---|---|
| Standard Bank & Trust Company | -- | None Available | |
| Smith Tyson R | $119,000 | Attorneys Title Guaranty Fun | |
| Mcrae James E | $136,000 | -- |
Source: Public Records
Mortgage History
| Date | Status | Borrower | Loan Amount |
|---|---|---|---|
| Previous Owner | Smith Tyson R | $115,983 | |
| Previous Owner | Mcrae James E | $138,720 |
Source: Public Records
Tax History Compared to Growth
Tax History
| Year | Tax Paid | Tax Assessment Tax Assessment Total Assessment is a certain percentage of the fair market value that is determined by local assessors to be the total taxable value of land and additions on the property. | Land | Improvement |
|---|---|---|---|---|
| 2024 | $9,003 | $22,000 | $4,125 | $17,875 |
| 2023 | $8,223 | $22,000 | $4,125 | $17,875 |
| 2022 | $8,223 | $16,740 | $3,563 | $13,177 |
| 2021 | $7,939 | $16,738 | $3,562 | $13,176 |
| 2020 | $7,591 | $16,738 | $3,562 | $13,176 |
| 2019 | $6,801 | $15,366 | $3,000 | $12,366 |
| 2018 | $6,502 | $15,366 | $3,000 | $12,366 |
| 2017 | $7,311 | $17,135 | $3,000 | $14,135 |
| 2016 | $6,334 | $14,745 | $2,812 | $11,933 |
| 2015 | $6,067 | $14,745 | $2,812 | $11,933 |
| 2014 | $7,798 | $15,972 | $2,812 | $13,160 |
| 2013 | $5,356 | $11,900 | $2,812 | $9,088 |
Source: Public Records
Map
Nearby Homes
- 1970 E 170th St
- 16909 Paxton Ave
- 16822 Merrill Ave
- 2024 E 171st Ct
- 17048 Clyde Ave
- 16747 Paxton Ave
- 2005 Fairview Ln
- 2155 Bernice Rd
- 500 Park Ave Unit 433
- 500 Park Ave Unit 238
- 500 Park Ave Unit 537
- 500 Park Ave Unit 236
- 400 Park Ave Unit 118
- 400 Park Ave Unit 411
- 400 Park Ave Unit 100
- 400 Park Ave Unit 211
- 300 Park Ave Unit 639
- 2237 175th St Unit 1B
- 2237 175th St Unit 2B
- 2304 Holiday Terrace Unit 503
- 16923 Merrill Ave
- 16904 Paxton Ave
- 16864 Paxton Ave
- 16912 Paxton Ave
- 16859 Merrill Ave
- 16931 Merrill Ave
- 16858 Paxton Ave
- 16920 Paxton Ave
- 16904 Merrill Ave
- 16926 Merrill Ave
- 16853 Merrill Ave
- 16858 Merrill Ave
- 16850 Paxton Ave
- 1925 E 169th Place
- 1980 E 170th St
- 1920 E 169th Place
- 1990 E 170th St
- 16923 Paxton Ave
- 16850 Merrill Ave
- 16845 Merrill Ave