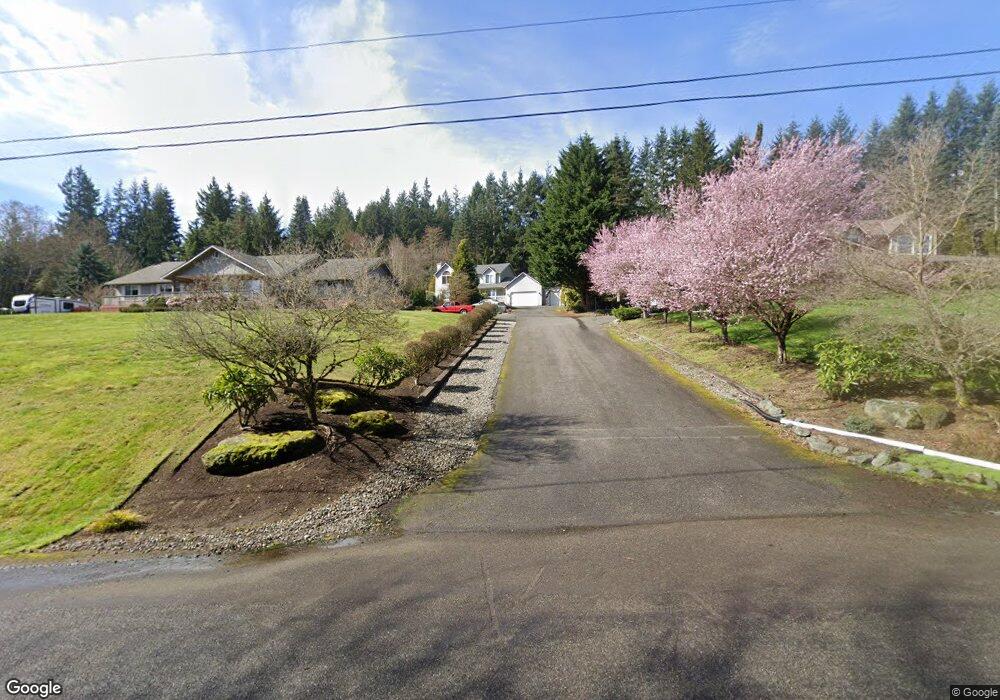
16918 E Interurban Blvd Snohomish, WA 98296
Cathcart NeighborhoodEstimated Value: $1,063,000 - $1,210,000
4
Beds
3
Baths
2,386
Sq Ft
$481/Sq Ft
Est. Value
About This Home
This home is located at 16918 E Interurban Blvd, Snohomish, WA 98296 and is currently estimated at $1,146,877, approximately $480 per square foot. 16918 E Interurban Blvd is a home located in Snohomish County with nearby schools including Cathcart Elementary School, Valley View Middle School, and Glacier Peak High School.
Ownership History
Date
Name
Owned For
Owner Type
Purchase Details
Closed on
Mar 6, 2012
Sold by
Fannie Mae
Bought by
Holst Christian Lee and Huges Kimberly Dawn
Current Estimated Value
Home Financials for this Owner
Home Financials are based on the most recent Mortgage that was taken out on this home.
Original Mortgage
$289,228
Outstanding Balance
$199,153
Interest Rate
3.92%
Mortgage Type
New Conventional
Estimated Equity
$947,724
Purchase Details
Closed on
Jul 25, 2011
Sold by
Eagon Donald E and Eagon Bonita M
Bought by
Federal National Mortgage Association
Purchase Details
Closed on
Nov 16, 1995
Sold by
Heath Kelly and Heath Kerry
Bought by
Eagon Donald B and Eagon Bonita M
Home Financials for this Owner
Home Financials are based on the most recent Mortgage that was taken out on this home.
Original Mortgage
$150,000
Interest Rate
7.58%
Create a Home Valuation Report for This Property
The Home Valuation Report is an in-depth analysis detailing your home's value as well as a comparison with similar homes in the area
Home Values in the Area
Average Home Value in this Area
Purchase History
| Date | Buyer | Sale Price | Title Company |
|---|---|---|---|
| Holst Christian Lee | -- | Old Republic Title Ltd | |
| Federal National Mortgage Association | $453,932 | None Available | |
| Eagon Donald B | $249,950 | Transamerica Title Insurance |
Source: Public Records
Mortgage History
| Date | Status | Borrower | Loan Amount |
|---|---|---|---|
| Open | Holst Christian Lee | $289,228 | |
| Previous Owner | Eagon Donald B | $150,000 |
Source: Public Records
Tax History Compared to Growth
Tax History
| Year | Tax Paid | Tax Assessment Tax Assessment Total Assessment is a certain percentage of the fair market value that is determined by local assessors to be the total taxable value of land and additions on the property. | Land | Improvement |
|---|---|---|---|---|
| 2025 | $9,615 | $986,200 | $572,100 | $414,100 |
| 2024 | $9,615 | $956,700 | $556,500 | $400,200 |
| 2023 | $10,188 | $1,130,500 | $669,600 | $460,900 |
| 2022 | $9,281 | $825,800 | $432,700 | $393,100 |
| 2020 | $8,023 | $712,800 | $360,400 | $352,400 |
| 2019 | $7,685 | $638,500 | $310,400 | $328,100 |
| 2018 | $8,458 | $584,500 | $290,400 | $294,100 |
| 2017 | $7,020 | $497,000 | $220,400 | $276,600 |
| 2016 | $6,962 | $475,600 | $210,400 | $265,200 |
| 2015 | $6,660 | $436,700 | $190,400 | $246,300 |
| 2013 | $5,918 | $373,100 | $155,000 | $218,100 |
Source: Public Records
Map
Nearby Homes
- 8224 172nd St SE
- 0 172nd St SE
- 17410 87th Ave SE Unit 29
- 17304 Washington 9
- 17720 87th Ave SE
- 8815 164th St SE
- 16031 State Route 9 SE
- 16714 Broadway Ave
- 9731 170th St SE
- 16425 Broadway Ave
- 18228 Broadway Ave
- 10101 Elliott Rd
- 16106 Broadway Ave
- 16429 Snohomish Ave
- 8528 152nd St SE
- 16012 Market St
- 18132 Waverly Dr
- 15421 State St
- 15329 78th Ave SE
- 7331 156th St SE
- 16924 E Interurban Blvd
- 16910 E Interurban Blvd
- 17008 E Interurban Blvd
- 8609 172nd St SE
- 16832 E Interurban Blvd
- 17016 E Interurban Blvd
- 16923 E Interurban Blvd
- 8711 172nd St SE
- 16821 E Interurban Blvd
- 16826 E Interurban Blvd
- 8510 168th St SE
- 17015 E Interurban Blvd
- 16811 E Interurban Blvd
- 8723 172nd St SE
- 17030 E Interurban Blvd
- 8706 172nd St SE
- 17019 E Interurban Blvd
- 8624 172nd St SE
- 8722 172nd St SE
- 8627 168th St SE