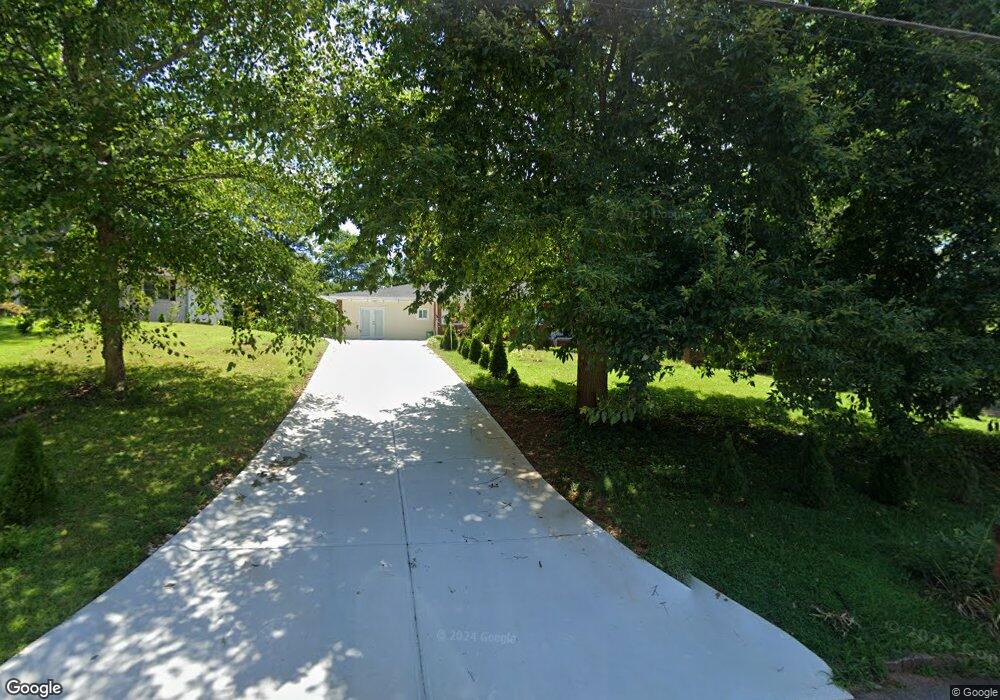
1692 Camelot Cir Tucker, GA 30084
Estimated Value: $332,812 - $381,000
3
Beds
2
Baths
1,503
Sq Ft
$231/Sq Ft
Est. Value
About This Home
This home is located at 1692 Camelot Cir, Tucker, GA 30084 and is currently estimated at $347,453, approximately $231 per square foot. 1692 Camelot Cir is a home located in DeKalb County with nearby schools including Idlewood Elementary School, Tucker Middle School, and Tucker High School.
Ownership History
Date
Name
Owned For
Owner Type
Purchase Details
Closed on
Dec 22, 2008
Sold by
Preston Steven C
Bought by
Tessema Taye M and Woldemariam Bezunesh
Current Estimated Value
Home Financials for this Owner
Home Financials are based on the most recent Mortgage that was taken out on this home.
Original Mortgage
$138,411
Outstanding Balance
$91,321
Interest Rate
6.1%
Mortgage Type
New Conventional
Estimated Equity
$256,132
Purchase Details
Closed on
Apr 1, 2008
Sold by
Lopez Oscar C
Bought by
Countrywide Home Loans Inc
Purchase Details
Closed on
Apr 19, 2004
Sold by
Vandoan Tri
Bought by
Lopez Oscar C
Home Financials for this Owner
Home Financials are based on the most recent Mortgage that was taken out on this home.
Original Mortgage
$163,703
Interest Rate
5.35%
Mortgage Type
VA
Purchase Details
Closed on
Oct 24, 1995
Sold by
Noel Peter C Claudette
Bought by
Doan Tri V
Create a Home Valuation Report for This Property
The Home Valuation Report is an in-depth analysis detailing your home's value as well as a comparison with similar homes in the area
Home Values in the Area
Average Home Value in this Area
Purchase History
| Date | Buyer | Sale Price | Title Company |
|---|---|---|---|
| Tessema Taye M | -- | -- | |
| Countrywide Home Loans Inc | $184,280 | -- | |
| Hud-Housing Of Urban Dev | -- | -- | |
| Countrywide Home Loans Inc | -- | -- | |
| Lopez Oscar C | $165,000 | -- | |
| Doan Tri V | $90,900 | -- |
Source: Public Records
Mortgage History
| Date | Status | Borrower | Loan Amount |
|---|---|---|---|
| Open | Tessema Taye M | $138,411 | |
| Previous Owner | Lopez Oscar C | $163,703 | |
| Closed | Doan Tri V | $0 |
Source: Public Records
Tax History Compared to Growth
Tax History
| Year | Tax Paid | Tax Assessment Tax Assessment Total Assessment is a certain percentage of the fair market value that is determined by local assessors to be the total taxable value of land and additions on the property. | Land | Improvement |
|---|---|---|---|---|
| 2025 | $985 | $130,840 | $32,000 | $98,840 |
| 2024 | $1,023 | $118,440 | $32,000 | $86,440 |
| 2023 | $1,023 | $117,080 | $32,000 | $85,080 |
| 2022 | $2,866 | $96,840 | $26,000 | $70,840 |
| 2021 | $2,616 | $84,520 | $26,000 | $58,520 |
| 2020 | $1,913 | $57,240 | $14,320 | $42,920 |
| 2019 | $2,009 | $60,840 | $14,320 | $46,520 |
| 2018 | $1,821 | $59,600 | $17,320 | $42,280 |
| 2017 | $2,164 | $63,000 | $17,320 | $45,680 |
| 2016 | $1,889 | $56,240 | $17,320 | $38,920 |
| 2014 | $1,452 | $43,720 | $17,320 | $26,400 |
Source: Public Records
Map
Nearby Homes
- 4074 Idlevale Dr
- 3965 Camelot Ct
- 3952 Cedar Cir
- 4166 Idlevale Dr
- 4128 Cedar Knoll Dr
- 4201 Chatford Cove
- 1620 Idlewood Rd
- 1372 Idlewood Parc Crossing
- 4133 Idlewood Parc Ct
- 4188 Cedar Knoll Dr
- 1399 Sagewood Cir
- 1367 Wenlock Edge Cove
- 4125 Stutz Ct
- 1428 Orchard Park Dr Unit 1428
- 1394 Orchard Park Dr
- 2200 Idlewood Rd
- 1572 Darwen Ln
- 1700 Camelot Cir Unit 3
- 1686 Camelot Cir
- 0 Camelot Cir Unit 7226721
- 0 Camelot Cir Unit 8459088
- 0 Camelot Cir Unit 8036550
- 0 Camelot Cir Unit 8551554
- 0 Camelot Cir Unit 7448926
- 0 Camelot Cir Unit 8752376
- 0 Camelot Cir Unit 3171374
- 0 Camelot Cir Unit 3181774
- 0 Camelot Cir Unit 3258336
- 0 Camelot Cir Unit 3281342
- 0 Camelot Cir
- 1706 Camelot Cir Unit 3
- 1456 Idlewood Rd
- 1448 Idlewood Rd
- 1462 Idlewood Rd
- 1676 Camelot Cir Unit 3
- 1697 Camelot Cir
- 1440 Idlewood Rd