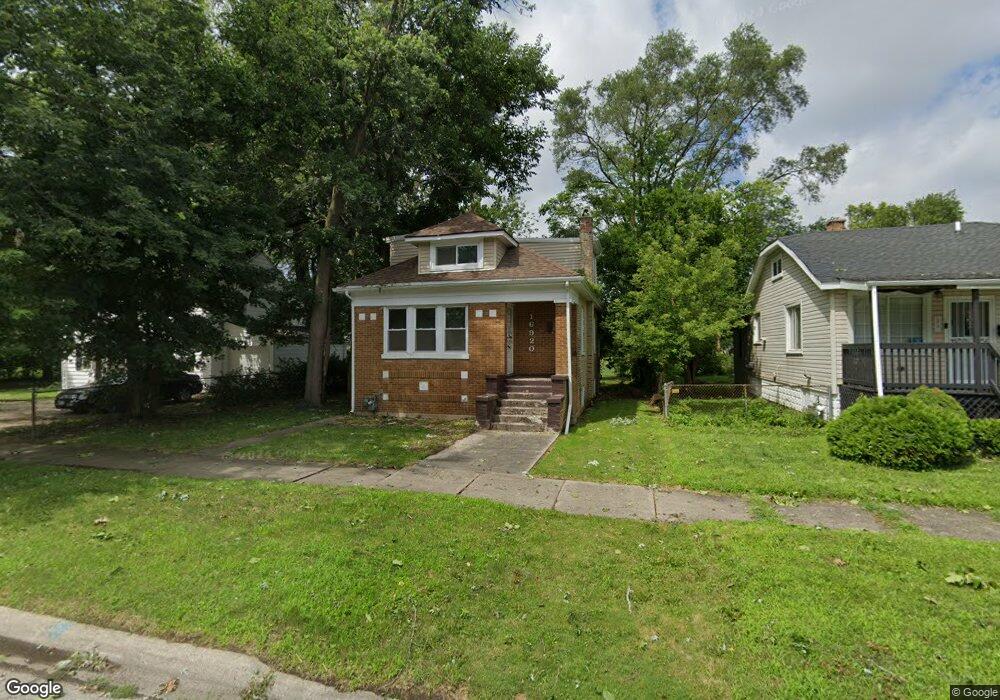
16920 Bulger Ave Hazel Crest, IL 60429
Hazel Crest Proper NeighborhoodEstimated Value: $130,295 - $172,000
3
Beds
1
Bath
1,399
Sq Ft
$109/Sq Ft
Est. Value
About This Home
This home is located at 16920 Bulger Ave, Hazel Crest, IL 60429 and is currently estimated at $153,074, approximately $109 per square foot. 16920 Bulger Ave is a home located in Cook County with nearby schools including Thornwood High School.
Ownership History
Date
Name
Owned For
Owner Type
Purchase Details
Closed on
Aug 6, 2019
Sold by
Looking Glass Opportunity Fund Ltd
Bought by
Stony Southside Rentals Llc
Current Estimated Value
Purchase Details
Closed on
Aug 2, 2018
Sold by
Community Initiatives Inc
Bought by
Looking Glass Opportunity Fund Llc
Purchase Details
Closed on
Jan 10, 2018
Sold by
Federal Home Loan Mortgage Corporation
Bought by
Community Initiatives Inc
Purchase Details
Closed on
Jun 20, 2017
Sold by
Caliber Home Loans Inc
Bought by
Federal Home Loan Mortgage Corporation
Purchase Details
Closed on
Jun 4, 2003
Sold by
Chicke Judith Ann
Bought by
Martin Andre P
Home Financials for this Owner
Home Financials are based on the most recent Mortgage that was taken out on this home.
Original Mortgage
$81,274
Interest Rate
5.3%
Mortgage Type
FHA
Create a Home Valuation Report for This Property
The Home Valuation Report is an in-depth analysis detailing your home's value as well as a comparison with similar homes in the area
Home Values in the Area
Average Home Value in this Area
Purchase History
| Date | Buyer | Sale Price | Title Company |
|---|---|---|---|
| Stony Southside Rentals Llc | -- | Attorney | |
| Looking Glass Opportunity Fund Llc | $28,000 | First American Title | |
| Community Initiatives Inc | $39,000 | First American Title | |
| Federal Home Loan Mortgage Corporation | -- | None Available | |
| Martin Andre P | $82,000 | Pntn |
Source: Public Records
Mortgage History
| Date | Status | Borrower | Loan Amount |
|---|---|---|---|
| Previous Owner | Martin Andre P | $81,274 |
Source: Public Records
Tax History
| Year | Tax Paid | Tax Assessment Tax Assessment Total Assessment is a certain percentage of the fair market value that is determined by local assessors to be the total taxable value of land and additions on the property. | Land | Improvement |
|---|---|---|---|---|
| 2025 | $4,163 | $6,500 | $1,085 | $5,415 |
| 2024 | $4,163 | $6,500 | $1,085 | $5,415 |
| 2023 | $4,875 | $6,500 | $1,085 | $5,415 |
| 2022 | $4,875 | $5,632 | $930 | $4,702 |
| 2021 | $4,739 | $5,631 | $930 | $4,701 |
| 2020 | $4,443 | $5,631 | $930 | $4,701 |
| 2019 | $5,188 | $6,634 | $852 | $5,782 |
| 2018 | $2,435 | $6,634 | $852 | $5,782 |
| 2017 | $2,400 | $6,634 | $852 | $5,782 |
| 2016 | $2,566 | $6,293 | $775 | $5,518 |
| 2015 | $2,406 | $6,293 | $775 | $5,518 |
| 2014 | $2,411 | $6,293 | $775 | $5,518 |
| 2013 | $2,296 | $6,518 | $775 | $5,743 |
Source: Public Records
Map
Nearby Homes
- 2030 170th St
- 17026 Bulger Ave
- 17031 Trapet Ave
- 2131 170th St
- 16840 Bulger Ave
- 16876 Head Ave
- 16927 Crane Ave
- 16802 Bulger Ave
- 16930 Winchester Ave
- 2159 171st St
- 17046 Winchester Ave
- 16963 Winchester Ave
- 17031 Anthony Ave
- 1913 170th St
- 16781 Head Ave
- 16841 Anthony Ave
- 16735 Dixie Hwy
- 16784 Crane Ave
- 16727 Head Ave
- 17092 Lincoln St
- 16920 Bulger Ave
- 16910 Bulger Ave
- 16910 Bulger Ave
- 16930 Bulger Ave
- 16930 Bulger Ave
- 16935 Trapet Ave
- 16935 Trapet Ave
- 16939 Trapet Ave
- 16939 Trapet Ave
- 16923 Bulger Ave
- 16909 Bulger Ave
- 16909 Bulger Ave
- 16950 Bulger Ave
- 16950 Bulger Ave
- 16903 Bulger Ave
- 16903 Bulger Ave
- 16935 Bulger Ave
- 16951 Trapet Ave
- 16951 Trapet Ave
- 16962 Bulger Ave
Your Personal Tour Guide
Ask me questions while you tour the home.