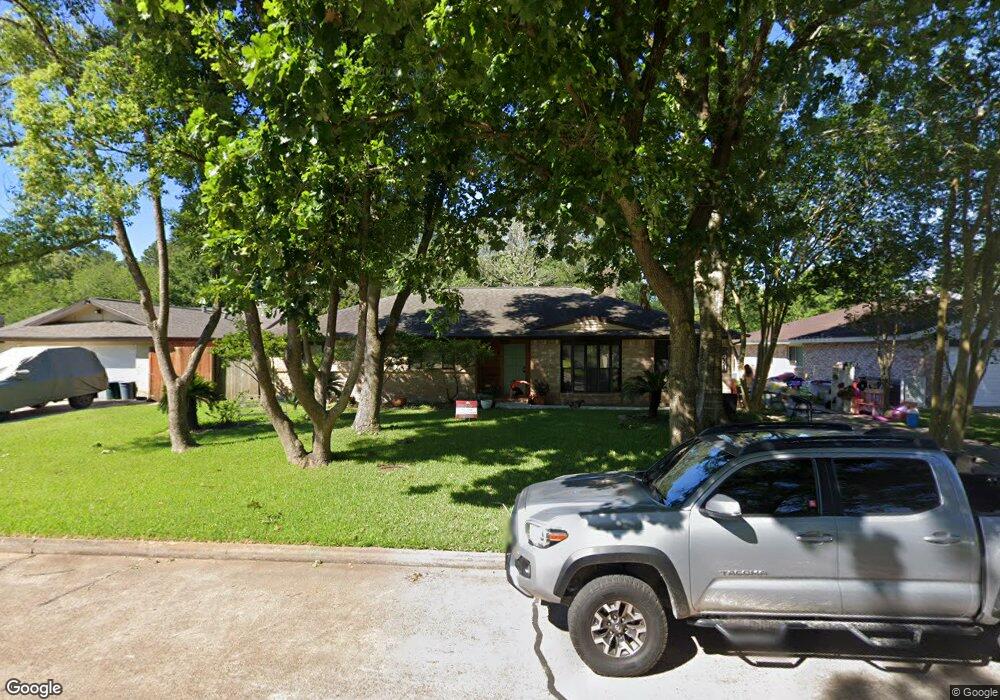
16922 Creek Line Dr Friendswood, TX 77546
Estimated Value: $289,000 - $326,000
4
Beds
2
Baths
1,944
Sq Ft
$159/Sq Ft
Est. Value
About This Home
This home is located at 16922 Creek Line Dr, Friendswood, TX 77546 and is currently estimated at $308,678, approximately $158 per square foot. 16922 Creek Line Dr is a home located in Harris County with nearby schools including Wedgewood Elementary School, Brookside Intermediate School, and Clear Brook High School.
Ownership History
Date
Name
Owned For
Owner Type
Purchase Details
Closed on
Aug 28, 2014
Sold by
Rosselit Christopher and Rosselit Kelly K
Bought by
Tinney Richard D
Current Estimated Value
Home Financials for this Owner
Home Financials are based on the most recent Mortgage that was taken out on this home.
Original Mortgage
$163,000
Outstanding Balance
$124,473
Interest Rate
4.15%
Mortgage Type
VA
Estimated Equity
$184,205
Purchase Details
Closed on
Jun 5, 2012
Sold by
Silva Julie Lynn Schroeder and Schaffer Julie L
Bought by
Rosselt Kelly K and Rosselt Christopher
Home Financials for this Owner
Home Financials are based on the most recent Mortgage that was taken out on this home.
Original Mortgage
$127,645
Interest Rate
3.75%
Mortgage Type
FHA
Purchase Details
Closed on
Sep 11, 1996
Sold by
Silva Thomas John
Bought by
Silva Julie Lynn Schroeder
Create a Home Valuation Report for This Property
The Home Valuation Report is an in-depth analysis detailing your home's value as well as a comparison with similar homes in the area
Home Values in the Area
Average Home Value in this Area
Purchase History
| Date | Buyer | Sale Price | Title Company |
|---|---|---|---|
| Tinney Richard D | -- | Alamo Title Co | |
| Rosselt Kelly K | -- | None Available | |
| Rosselt Kelly K | -- | None Available | |
| Silva Julie Lynn Schroeder | -- | -- |
Source: Public Records
Mortgage History
| Date | Status | Borrower | Loan Amount |
|---|---|---|---|
| Open | Tinney Richard D | $163,000 | |
| Previous Owner | Rosselt Kelly K | $127,645 |
Source: Public Records
Tax History Compared to Growth
Tax History
| Year | Tax Paid | Tax Assessment Tax Assessment Total Assessment is a certain percentage of the fair market value that is determined by local assessors to be the total taxable value of land and additions on the property. | Land | Improvement |
|---|---|---|---|---|
| 2025 | -- | $354,930 | $74,680 | $280,250 |
| 2024 | -- | $327,858 | $74,680 | $253,178 |
| 2023 | $1,029 | $292,880 | $74,680 | $218,200 |
| 2022 | $4,964 | $276,502 | $74,680 | $201,822 |
| 2021 | $4,758 | $235,713 | $61,001 | $174,712 |
| 2020 | $4,699 | $208,470 | $42,940 | $165,530 |
| 2019 | $3,762 | $153,141 | $32,898 | $120,243 |
| 2018 | $645 | $133,200 | $35,375 | $97,825 |
| 2017 | $9,088 | $176,051 | $35,375 | $140,676 |
| 2016 | $4,476 | $173,422 | $35,375 | $138,047 |
| 2015 | $3,636 | $159,699 | $35,375 | $124,324 |
| 2014 | $3,636 | $138,376 | $29,479 | $108,897 |
Source: Public Records
Map
Nearby Homes
- 4430 Peridot Ln
- 4426 Saffron Ln
- 1303 Deepwood Dr
- 4315 Ravine Dr
- 16903 Paint Rock Rd
- 210 Victoria Way
- 5498 Apple Blossom Ln
- 4015 Ravine Dr
- 1201 Arbre Ln
- 16703 Hibiscus Ln
- 604 N Clear Creek Dr
- 17015 Townes Rd
- Magnolia Plan at Beamer Villas
- 417 Forest Pines Ct
- 16607 David Glen Dr
- 16423 Hibiscus Ln
- 16907 Tibet Rd
- 3836 Laura Leigh Dr
- 64 Hideaway Dr
- 42 Hideaway Dr Unit D1
- 16926 Creek Line Dr
- 16918 Creek Line Dr
- 16930 Creek Line Dr
- 16919 Creek Line Dr
- 16923 Creek Line Dr
- 16914 Creek Line Dr
- 16915 Creek Line Dr
- 16927 Creek Line Dr
- 16934 Creek Line Dr
- 16911 Creek Line Dr
- 16910 Creek Line Dr
- 16931 Creek Line Dr
- 16938 Creek Line Dr
- 16903 Creek Line Dr
- 16902 Oxnard Ln
- 16906 Oxnard Ln
- 16935 Creek Line Dr
- 16910 Oxnard Ln
- 16914 Oxnard Ln
- 16906 Creek Line Dr