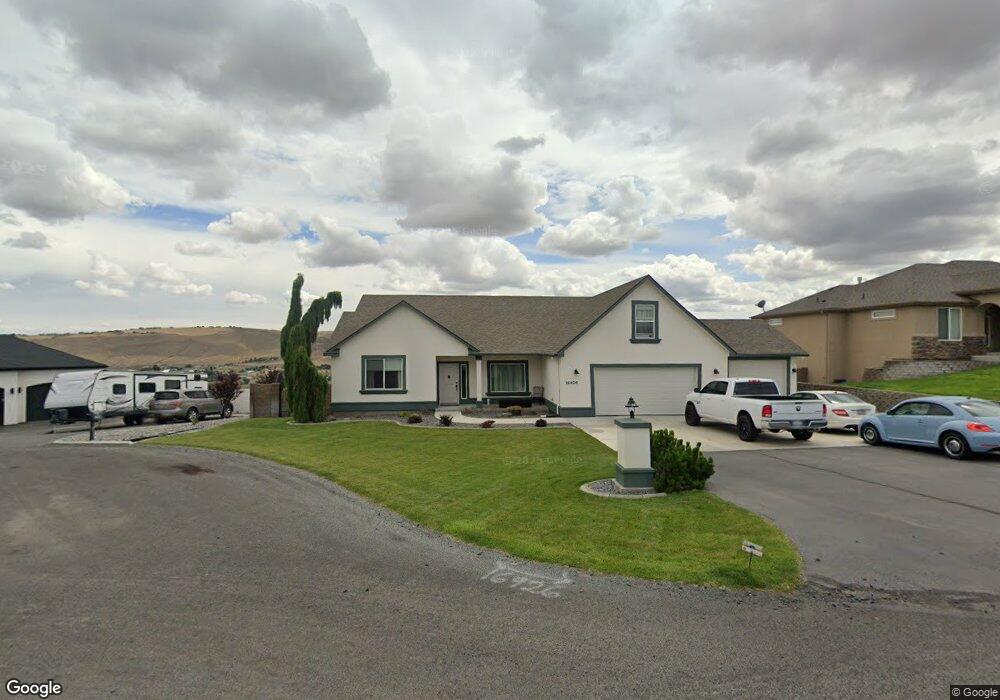
16926 S Fairview Loop Unit Spectacular View Kennewick, WA 99338
Estimated Value: $624,000 - $727,000
3
Beds
2
Baths
2,076
Sq Ft
$321/Sq Ft
Est. Value
About This Home
This home is located at 16926 S Fairview Loop Unit Spectacular View, Kennewick, WA 99338 and is currently estimated at $665,878, approximately $320 per square foot. 16926 S Fairview Loop Unit Spectacular View is a home located in Benton County with nearby schools including Cottonwood Elementary School, Desert Hills Middle School, and Kamiakin High School.
Ownership History
Date
Name
Owned For
Owner Type
Purchase Details
Closed on
Aug 23, 2021
Sold by
Laing James P and Laing Karin A
Bought by
Mercure Jane L
Current Estimated Value
Purchase Details
Closed on
Feb 12, 2015
Sold by
Graves Ryan D and Graves Natalie G
Bought by
Laing James P and Laing Karin A
Home Financials for this Owner
Home Financials are based on the most recent Mortgage that was taken out on this home.
Original Mortgage
$271,920
Interest Rate
3.8%
Mortgage Type
New Conventional
Purchase Details
Closed on
Dec 11, 2009
Sold by
Sr Homes Llc
Bought by
Graves Ryan D and Graves Natalie G
Home Financials for this Owner
Home Financials are based on the most recent Mortgage that was taken out on this home.
Original Mortgage
$280,728
Interest Rate
4.91%
Mortgage Type
New Conventional
Create a Home Valuation Report for This Property
The Home Valuation Report is an in-depth analysis detailing your home's value as well as a comparison with similar homes in the area
Home Values in the Area
Average Home Value in this Area
Purchase History
| Date | Buyer | Sale Price | Title Company |
|---|---|---|---|
| Mercure Jane L | $515,730 | Cascade Title Company | |
| Laing James P | $291,880 | Stewart Title Co 1 | |
| Graves Ryan D | $268,111 | Stewart Title Co 1 |
Source: Public Records
Mortgage History
| Date | Status | Borrower | Loan Amount |
|---|---|---|---|
| Previous Owner | Laing James P | $271,920 | |
| Previous Owner | Graves Ryan D | $280,728 |
Source: Public Records
Tax History Compared to Growth
Tax History
| Year | Tax Paid | Tax Assessment Tax Assessment Total Assessment is a certain percentage of the fair market value that is determined by local assessors to be the total taxable value of land and additions on the property. | Land | Improvement |
|---|---|---|---|---|
| 2024 | $5,942 | $698,960 | $175,000 | $523,960 |
| 2023 | $5,942 | $661,540 | $175,000 | $486,540 |
| 2022 | $4,521 | $449,020 | $95,000 | $354,020 |
| 2021 | $4,240 | $414,760 | $95,000 | $319,760 |
| 2020 | $4,538 | $380,500 | $95,000 | $285,500 |
| 2019 | $4,395 | $391,920 | $95,000 | $296,920 |
| 2018 | $4,362 | $391,920 | $95,000 | $296,920 |
| 2017 | $4,051 | $323,400 | $95,000 | $228,400 |
| 2016 | $4,107 | $324,790 | $66,700 | $258,090 |
| 2015 | $4,129 | $324,790 | $66,700 | $258,090 |
| 2014 | -- | $323,490 | $65,400 | $258,090 |
| 2013 | -- | $323,490 | $65,400 | $258,090 |
Source: Public Records
Map
Nearby Homes
- 87069 E Haven View Prairie SE
- 89703 E Sagebrush Rd
- 82503 E Wallowa Rd
- 91804 E 83 Prairie SE
- 3721 Morningside Pkwy
- 3646 Morningside Pkwy
- 3557 Allison Way
- 27509 S 932 Prairie SE
- 3733 Nuthatch St
- 3677 Nuthatch St
- 3741 Nuthatch St
- 3718 Nuthatch St
- 29404 S 816 Prairie SE
- 100203 162 Prairie SE
- 2988 Tarragon Ave
- 3683 Allison Way Lot 169
- 6114 W 32nd Ave
- 3725 Nuthatch St
- 2956 Tarragon Ave
- 3481 Morningside Pkwy
- 16926 S Fairview Loop
- 16824 S Fairview Loop
- 17028 S Fairview Loop
- 17028 S Fairview Loop Unit AMAZING VIEW OVERLOO
- 16722 S Fairview Loop
- 16722 S Fairview Loop
- 16925 S Fairview Loop
- 16723 S Fairview Loop
- 17232 S Fairview Loop
- 16620 S Fairview Loop
- 17334 S Fairview Loop
- 16723 S Fairview Loop Unit Stylish & Wonderful
- 16723 S Fairview Loop Unit Room for shop & pool
- 16723 S Fairview Loop
- 17333 S Fairview Loop
- 16511 S Fairview Loop
- 16511 S Fairview Loop
- 16511 S Fairview Loop Unit Reduced $20,000! Sol
- 16511 S Fairview Loop Unit Custom & Outdoor Liv
- 16511 S Fairview Loop Unit Custom & Outdoor Liv