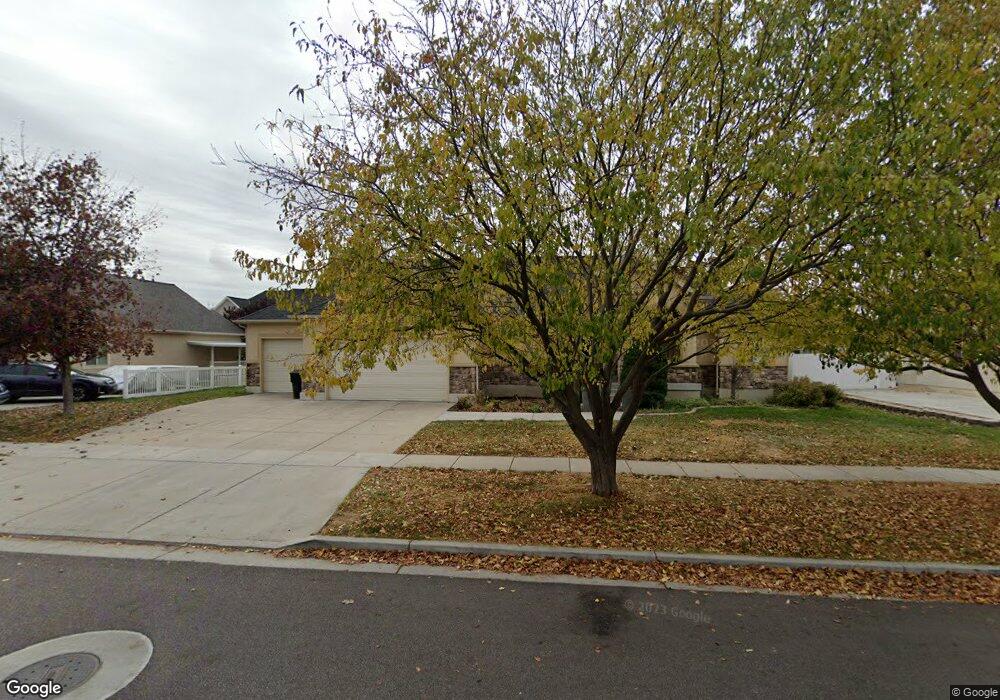
1693 W 2475 S Syracuse, UT 84075
Estimated Value: $568,000 - $627,000
3
Beds
2
Baths
3,357
Sq Ft
$181/Sq Ft
Est. Value
About This Home
This home is located at 1693 W 2475 S, Syracuse, UT 84075 and is currently estimated at $608,195, approximately $181 per square foot. 1693 W 2475 S is a home located in Davis County with nearby schools including Syracuse Elementary School, Syracuse Junior High School, and Syracuse High School.
Ownership History
Date
Name
Owned For
Owner Type
Purchase Details
Closed on
Feb 13, 2006
Sold by
Kealamakia Paul and Kealamakia Lisa
Bought by
Kealamakia Paul N and Kealamakia Lisa
Current Estimated Value
Home Financials for this Owner
Home Financials are based on the most recent Mortgage that was taken out on this home.
Original Mortgage
$27,617
Outstanding Balance
$15,458
Interest Rate
6.2%
Mortgage Type
Credit Line Revolving
Estimated Equity
$592,737
Purchase Details
Closed on
Jan 11, 2005
Sold by
Glass Luther Glessl and Glass Alison
Bought by
Glass Luther L and Glass Alison C
Purchase Details
Closed on
Jan 22, 2003
Sold by
Rainey Homes Inc
Bought by
Kealamakia Paul and Kealamakia Lisa
Home Financials for this Owner
Home Financials are based on the most recent Mortgage that was taken out on this home.
Original Mortgage
$182,320
Interest Rate
5.96%
Create a Home Valuation Report for This Property
The Home Valuation Report is an in-depth analysis detailing your home's value as well as a comparison with similar homes in the area
Home Values in the Area
Average Home Value in this Area
Purchase History
| Date | Buyer | Sale Price | Title Company |
|---|---|---|---|
| Kealamakia Paul N | -- | Backman Title Services | |
| Glass Luther L | -- | None Available | |
| Kealamakia Paul | -- | Heritage West Title Insuranc |
Source: Public Records
Mortgage History
| Date | Status | Borrower | Loan Amount |
|---|---|---|---|
| Open | Kealamakia Paul N | $27,617 | |
| Previous Owner | Kealamakia Paul | $182,320 |
Source: Public Records
Tax History Compared to Growth
Tax History
| Year | Tax Paid | Tax Assessment Tax Assessment Total Assessment is a certain percentage of the fair market value that is determined by local assessors to be the total taxable value of land and additions on the property. | Land | Improvement |
|---|---|---|---|---|
| 2025 | $3,061 | $295,350 | $124,377 | $170,973 |
| 2024 | $3,069 | $298,100 | $102,310 | $195,790 |
| 2023 | $2,966 | $525,000 | $142,589 | $382,411 |
| 2022 | $3,174 | $308,000 | $82,156 | $225,844 |
| 2021 | $2,776 | $417,000 | $121,346 | $295,654 |
| 2020 | $2,482 | $361,000 | $105,986 | $255,014 |
| 2019 | $2,417 | $347,000 | $103,253 | $243,747 |
| 2018 | $2,260 | $322,000 | $99,905 | $222,095 |
| 2016 | $2,016 | $150,645 | $38,358 | $112,287 |
| 2015 | $1,978 | $140,800 | $38,358 | $102,442 |
| 2014 | $2,024 | $146,775 | $38,358 | $108,417 |
| 2013 | -- | $137,015 | $36,655 | $100,360 |
Source: Public Records
Map
Nearby Homes
- 2742 S Allison Way Unit 212
- 1667 W 2770 S Unit 206
- 2208 W 2615 S Unit 141
- 2194 S 1800 W
- 2734 S Allison Way Unit 213
- 2650 S 2000 W
- 2306 S 2000 W
- 1315 W 2325 S
- 1295 W 2325 S
- 1306 W 2325 S
- 1286 W 2325 S
- 2355 S 1230 W
- 2104 W 2200 S
- 2983 S 1765 W
- 1196 W 2325 S
- 2136 W 2200 S
- 2154 W 2700 S
- 2455 S Bluff Rd
- 1156 W 2325 S
- 1137 W 2500 S