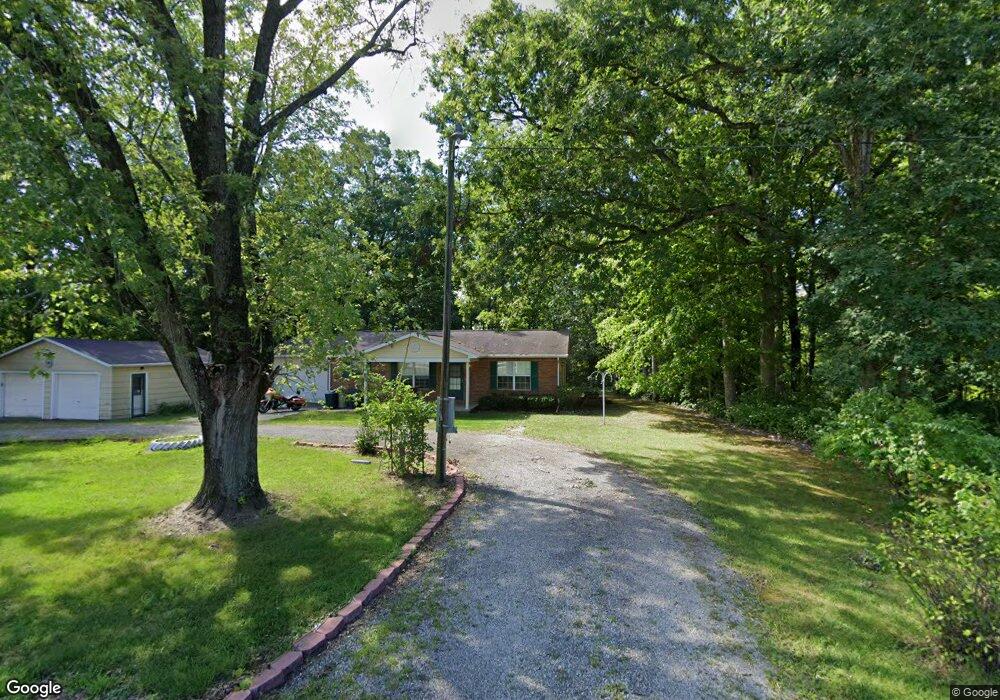
16930 E County Road 600n Charleston, IL 61920
Estimated Value: $171,000 - $191,000
2
Beds
2
Baths
1,092
Sq Ft
$164/Sq Ft
Est. Value
About This Home
This home is located at 16930 E County Road 600n, Charleston, IL 61920 and is currently estimated at $179,491, approximately $164 per square foot. 16930 E County Road 600n is a home located in Coles County with nearby schools including Charleston High School, Charleston Christian Academy, and Charleston Christian Academy High School.
Ownership History
Date
Name
Owned For
Owner Type
Purchase Details
Closed on
Aug 23, 2023
Sold by
Hughes Hattie Ann and Hess Mechelle
Bought by
Kauffman David
Current Estimated Value
Home Financials for this Owner
Home Financials are based on the most recent Mortgage that was taken out on this home.
Original Mortgage
$139,500
Outstanding Balance
$136,573
Interest Rate
7.25%
Mortgage Type
New Conventional
Estimated Equity
$42,918
Purchase Details
Closed on
Aug 22, 2013
Sold by
Hess Mechelle
Bought by
Hughes Hattie Ann
Purchase Details
Closed on
Apr 29, 2010
Sold by
Burns Hattie Ann and Hughes Hattie Ann
Bought by
Hughes Hattie Ann and Hess Mechelle
Purchase Details
Closed on
Aug 25, 2008
Sold by
Schenk Sandra Joan and Davis Martha Joan
Bought by
Burns Hattie A
Home Financials for this Owner
Home Financials are based on the most recent Mortgage that was taken out on this home.
Original Mortgage
$95,000
Interest Rate
6.54%
Mortgage Type
VA
Create a Home Valuation Report for This Property
The Home Valuation Report is an in-depth analysis detailing your home's value as well as a comparison with similar homes in the area
Home Values in the Area
Average Home Value in this Area
Purchase History
| Date | Buyer | Sale Price | Title Company |
|---|---|---|---|
| Kauffman David | $155,000 | None Listed On Document | |
| Hughes Hattie Ann | -- | None Available | |
| Hughes Hattie Ann | -- | None Available | |
| Burns Hattie A | $95,000 | None Available |
Source: Public Records
Mortgage History
| Date | Status | Borrower | Loan Amount |
|---|---|---|---|
| Open | Kauffman David | $139,500 | |
| Previous Owner | Burns Hattie A | $95,000 |
Source: Public Records
Tax History Compared to Growth
Tax History
| Year | Tax Paid | Tax Assessment Tax Assessment Total Assessment is a certain percentage of the fair market value that is determined by local assessors to be the total taxable value of land and additions on the property. | Land | Improvement |
|---|---|---|---|---|
| 2024 | $1,969 | $33,416 | $3,559 | $29,857 |
| 2023 | $883 | $30,517 | $3,250 | $27,267 |
| 2022 | -- | $30,012 | $3,196 | $26,816 |
| 2021 | -- | $28,802 | $3,067 | $25,735 |
| 2020 | $1,547 | $29,842 | $3,178 | $26,664 |
| 2019 | $1,547 | $28,802 | $3,067 | $25,735 |
| 2018 | $1,547 | $28,802 | $3,067 | $25,735 |
| 2017 | $1,547 | $28,802 | $3,067 | $25,735 |
| 2016 | $1,949 | $28,802 | $3,067 | $25,735 |
| 2015 | $1,298 | $28,802 | $3,067 | $25,735 |
| 2014 | $1,298 | $28,802 | $3,067 | $25,735 |
| 2013 | $1,298 | $28,802 | $3,067 | $25,735 |
Source: Public Records
Map
Nearby Homes
- Lot 5 Tammy Dale Ln
- Lot #7 Reserves Ct
- Lot #2 Reserves Ct
- Lot #5 Reserves Ct
- Lot #4 Reserves Ct
- Lot #3 Reserves Ct
- Lot #6 Reserves Ct
- Lot #9 Reserves Ct
- Lot #14 Reserves Ct
- Lot #17 Reserves Ct
- Lot #18 Reserves Ct
- Lot #10 Reserves Ct
- Lot #19 Reserves Ct
- Lot #8 Reserves Ct
- Lot #11 Reserves Ct
- Lot #12 Reserves Ct
- Lot #13 Reserves Ct
- Lot #15 Reserves Ct
- Lot #16 Reserves Ct
- Lot #31 Reserves Ct
- 16930 E County Road 600n
- 16930 E County Road 600n
- 16926 E County Road 600n
- 16926 E County Road 600n
- 16926 E County Road 600n
- 16924 E County Road 600n
- 16974 E County Road 600n
- 3133 18th St
- 16940 E County Road 600n
- 16940 E County Road 600n
- 16916 E County Road 600n
- 16916 E County Road 600n
- 16972 E County Road 600n
- 16870 E County Road 600n
- 16870 E County Road 600n
- 16870 E County Road 600n
- 3125 18th St
- 3229 18th St
- 16955 E County Road 600n
- 17107E E County Road 600n