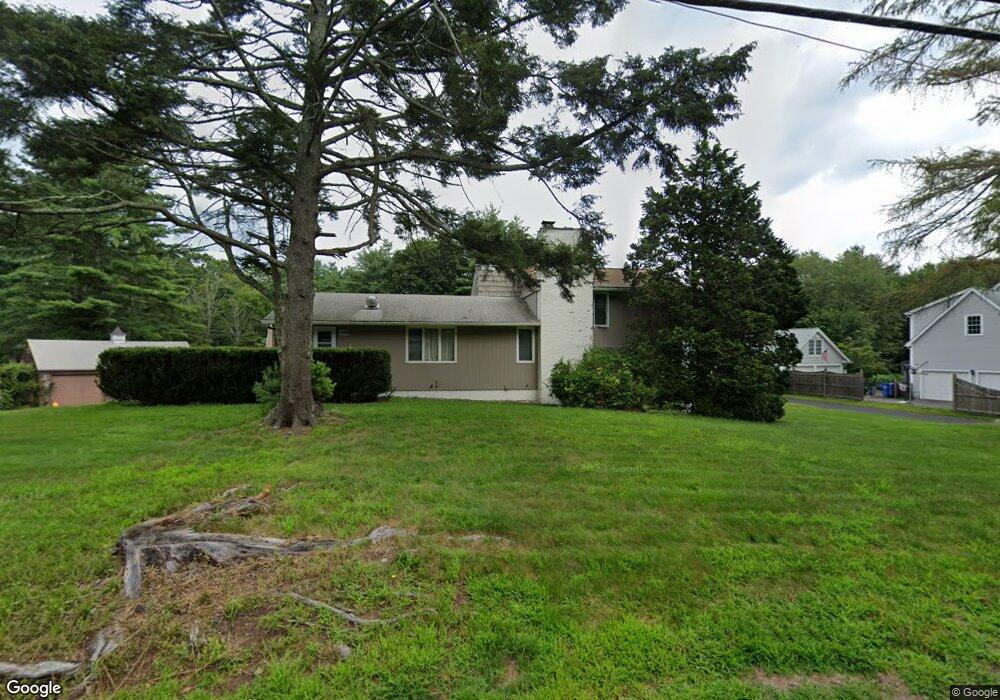
1694 West St Wrentham, MA 02093
West Wrentham NeighborhoodEstimated Value: $602,940 - $788,000
2
Beds
2
Baths
1,248
Sq Ft
$559/Sq Ft
Est. Value
About This Home
This home is located at 1694 West St, Wrentham, MA 02093 and is currently estimated at $697,735, approximately $559 per square foot. 1694 West St is a home located in Norfolk County with nearby schools including Delaney Elementary School, Charles E Roderick, and Mercymount Country Day School.
Ownership History
Date
Name
Owned For
Owner Type
Purchase Details
Closed on
May 30, 1997
Sold by
Giberti Eleanor L
Bought by
Piper Robert C
Current Estimated Value
Home Financials for this Owner
Home Financials are based on the most recent Mortgage that was taken out on this home.
Original Mortgage
$170,400
Interest Rate
8.09%
Mortgage Type
Purchase Money Mortgage
Create a Home Valuation Report for This Property
The Home Valuation Report is an in-depth analysis detailing your home's value as well as a comparison with similar homes in the area
Home Values in the Area
Average Home Value in this Area
Purchase History
| Date | Buyer | Sale Price | Title Company |
|---|---|---|---|
| Piper Robert C | $213,000 | -- |
Source: Public Records
Mortgage History
| Date | Status | Borrower | Loan Amount |
|---|---|---|---|
| Open | Piper Robert C | $200,000 | |
| Closed | Piper Robert C | $168,000 | |
| Closed | Piper Robert C | $170,400 |
Source: Public Records
Tax History Compared to Growth
Tax History
| Year | Tax Paid | Tax Assessment Tax Assessment Total Assessment is a certain percentage of the fair market value that is determined by local assessors to be the total taxable value of land and additions on the property. | Land | Improvement |
|---|---|---|---|---|
| 2025 | $6,764 | $583,600 | $297,200 | $286,400 |
| 2024 | $6,440 | $536,700 | $297,200 | $239,500 |
| 2023 | $6,078 | $481,600 | $271,100 | $210,500 |
| 2022 | $6,199 | $453,500 | $264,300 | $189,200 |
| 2021 | $6,506 | $462,400 | $247,600 | $214,800 |
| 2020 | $5,375 | $377,200 | $191,200 | $186,000 |
| 2019 | $5,069 | $359,000 | $173,000 | $186,000 |
| 2018 | $5,105 | $358,500 | $172,500 | $186,000 |
| 2017 | $4,836 | $339,400 | $169,200 | $170,200 |
| 2016 | $4,731 | $331,300 | $164,300 | $167,000 |
| 2015 | $4,819 | $321,700 | $174,600 | $147,100 |
| 2014 | $4,775 | $311,900 | $168,000 | $143,900 |
Source: Public Records
Map
Nearby Homes
- 50 Heather Ln
- 50 Wamsutta Way
- 60 Grant Ave
- 236 Williams St
- 39 Sumner Brown Rd
- 2095 West St
- 180 Pine Swamp Rd
- 56 Pine Swamp Rd
- 25 Nature View Dr
- 20 Nature View Dr
- 17 Stanford Rd
- 10 Stanford Rd
- 4 Evans St
- 300 Tower Hill Rd
- 851 Washington St
- 4022 Diamond Hill Rd
- 11 Amber Dr
- 584 Washington St
- 955 Summer St
- 80 Carriage House Ln