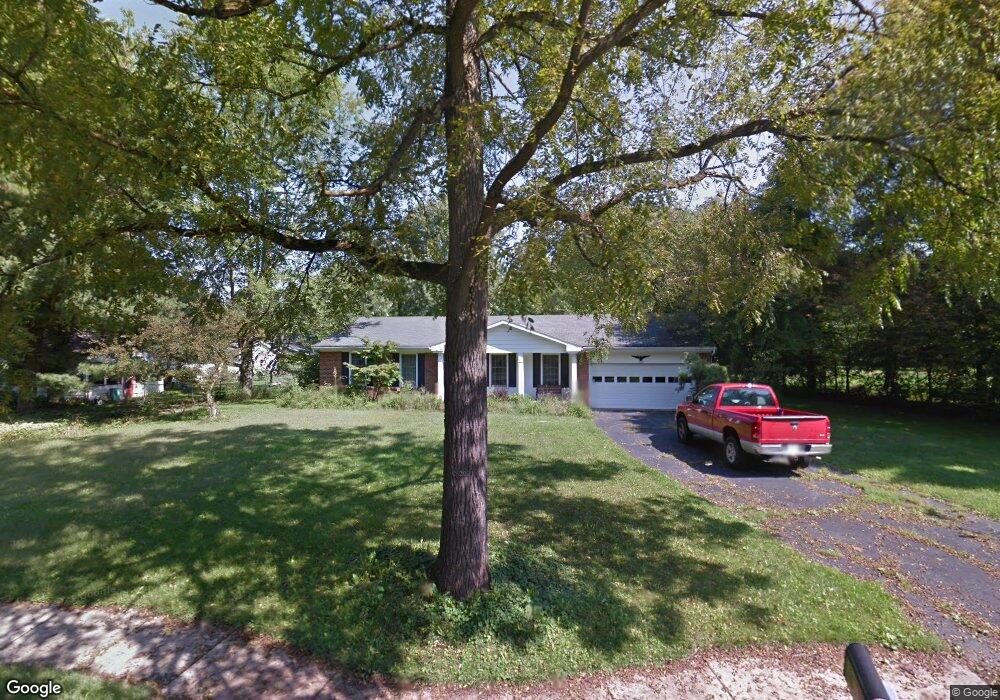
1695 Barlow Rd Hudson, OH 44236
Estimated Value: $362,000 - $388,000
3
Beds
2
Baths
1,818
Sq Ft
$205/Sq Ft
Est. Value
About This Home
This home is located at 1695 Barlow Rd, Hudson, OH 44236 and is currently estimated at $372,845, approximately $205 per square foot. 1695 Barlow Rd is a home located in Summit County with nearby schools including Ellsworth Hill Elementary School, East Woods Intermediate School, and Hudson Middle School.
Ownership History
Date
Name
Owned For
Owner Type
Purchase Details
Closed on
Jun 24, 2004
Sold by
Lawson Charles R and Lawson Grace Joanne
Bought by
Bellomo Brad
Current Estimated Value
Home Financials for this Owner
Home Financials are based on the most recent Mortgage that was taken out on this home.
Original Mortgage
$147,200
Outstanding Balance
$74,166
Interest Rate
6.46%
Mortgage Type
Purchase Money Mortgage
Estimated Equity
$298,679
Purchase Details
Closed on
Mar 17, 2004
Sold by
Lawson Grace Joanne and Lawson Charles R
Bought by
Lawson Charles R
Create a Home Valuation Report for This Property
The Home Valuation Report is an in-depth analysis detailing your home's value as well as a comparison with similar homes in the area
Home Values in the Area
Average Home Value in this Area
Purchase History
| Date | Buyer | Sale Price | Title Company |
|---|---|---|---|
| Bellomo Brad | $184,000 | Real Living Title Agency Ltd | |
| Lawson Charles R | -- | Approved Statewide Title |
Source: Public Records
Mortgage History
| Date | Status | Borrower | Loan Amount |
|---|---|---|---|
| Open | Bellomo Brad | $147,200 | |
| Closed | Bellomo Brad | $27,600 |
Source: Public Records
Tax History
| Year | Tax Paid | Tax Assessment Tax Assessment Total Assessment is a certain percentage of the fair market value that is determined by local assessors to be the total taxable value of land and additions on the property. | Land | Improvement |
|---|---|---|---|---|
| 2024 | $5,291 | $103,083 | $21,746 | $81,337 |
| 2023 | $5,291 | $103,083 | $21,746 | $81,337 |
| 2022 | $4,604 | $79,909 | $16,856 | $63,053 |
| 2021 | $4,143 | $79,909 | $16,856 | $63,053 |
| 2020 | $4,531 | $79,910 | $16,860 | $63,050 |
| 2019 | $4,287 | $69,910 | $16,860 | $53,050 |
| 2018 | $4,272 | $69,910 | $16,860 | $53,050 |
| 2017 | $3,674 | $69,910 | $16,860 | $53,050 |
| 2016 | $3,700 | $58,260 | $16,010 | $42,250 |
| 2015 | $3,674 | $58,260 | $16,010 | $42,250 |
| 2014 | $3,684 | $58,260 | $16,010 | $42,250 |
| 2013 | $3,883 | $60,050 | $16,860 | $43,190 |
Source: Public Records
Map
Nearby Homes
- 5974 Anna Lee Dr
- 1620 Sapphire Dr
- 171 Ravenna St
- 77 Parmelee Dr
- 5123 Sodalite Dr
- 42 Fox Trace Ln
- V/L Norton Rd
- 1995 Weston Dr
- 6492 Elmcrest Dr
- 213 E Streetsboro St
- 5091 Ridge Meadow Dr
- 12 N Oviatt St
- 43 N Oviatt St
- 179 Elm St
- 1525 Spruce Hill Dr
- 6740 Pinebrooke Dr
- 8 Hudson Common Dr Unit 8
- 338 Simon Rd
- 734 Barlow Rd
- 4704 Red Willow Rd
- 5771 Sunset Dr
- 5783 Sunset Dr
- 5768 Bradford Way
- 1715 Barlow Rd
- 1694 Barlow Rd
- 5774 Bradford Way
- 1702 Barlow Rd
- 5760 Bradford Way
- 5770 Sunset Dr
- 1727 Barlow Rd
- 5801 Sunset Dr
- 1706 Barlow Rd
- 1600 Amboy Dr
- 5631 Sunset Dr
- 5750 Bradford Way
- 5744 Sunset Dr
- 5784 Bradford Way
- 1655 Barlow Rd
- 1739 Barlow Rd
- 1730 Barlow Rd
Your Personal Tour Guide
Ask me questions while you tour the home.