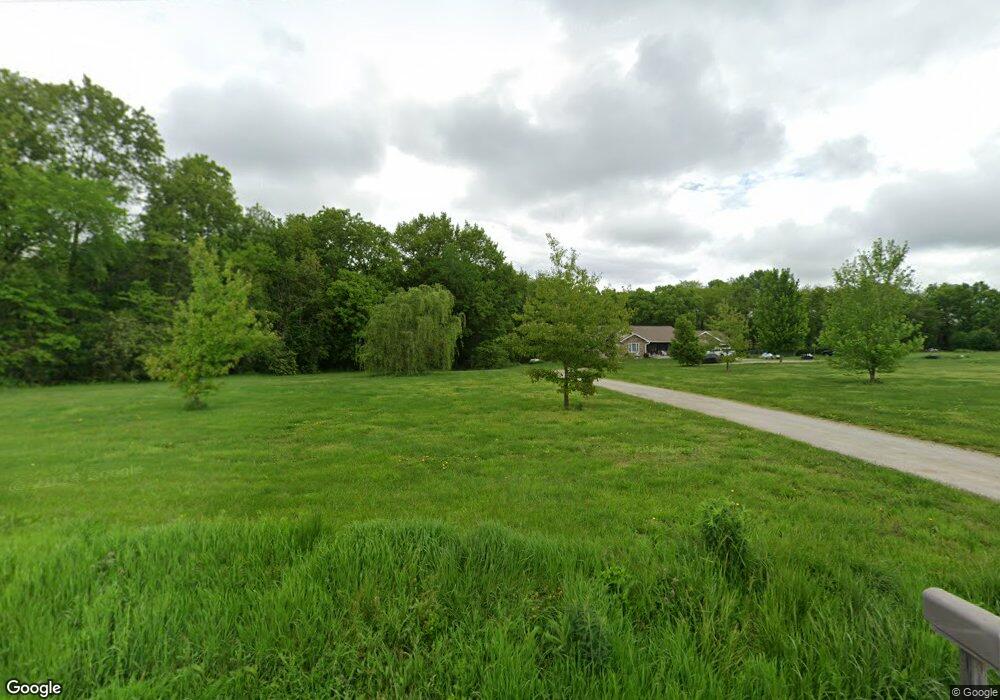
1695 E 1500 North Rd Taylorville, IL 62568
Estimated Value: $397,247 - $525,000
3
Beds
--
Bath
2,069
Sq Ft
$230/Sq Ft
Est. Value
About This Home
This home is located at 1695 E 1500 North Rd, Taylorville, IL 62568 and is currently estimated at $476,082, approximately $230 per square foot. 1695 E 1500 North Rd is a home located in Christian County with nearby schools including Stonington Elementary School, Taylorville Junior High School, and Taylorville Senior High School.
Ownership History
Date
Name
Owned For
Owner Type
Purchase Details
Closed on
Sep 6, 2013
Sold by
Shipley Joshua H and Shipley Carol C
Bought by
Cunningham Matthew E
Current Estimated Value
Home Financials for this Owner
Home Financials are based on the most recent Mortgage that was taken out on this home.
Original Mortgage
$324,800
Outstanding Balance
$242,280
Interest Rate
4.39%
Mortgage Type
VA
Estimated Equity
$233,802
Purchase Details
Closed on
Nov 6, 2009
Sold by
Gentry John A and Gentry Debra L
Bought by
Shipley Joshua H and Shipley Carol C
Home Financials for this Owner
Home Financials are based on the most recent Mortgage that was taken out on this home.
Original Mortgage
$280,000
Interest Rate
4.9%
Mortgage Type
New Conventional
Create a Home Valuation Report for This Property
The Home Valuation Report is an in-depth analysis detailing your home's value as well as a comparison with similar homes in the area
Home Values in the Area
Average Home Value in this Area
Purchase History
| Date | Buyer | Sale Price | Title Company |
|---|---|---|---|
| Cunningham Matthew E | $340,000 | None Available | |
| Shipley Joshua H | $350,000 | None Available |
Source: Public Records
Mortgage History
| Date | Status | Borrower | Loan Amount |
|---|---|---|---|
| Open | Cunningham Matthew E | $324,800 | |
| Previous Owner | Shipley Joshua H | $280,000 |
Source: Public Records
Tax History Compared to Growth
Tax History
| Year | Tax Paid | Tax Assessment Tax Assessment Total Assessment is a certain percentage of the fair market value that is determined by local assessors to be the total taxable value of land and additions on the property. | Land | Improvement |
|---|---|---|---|---|
| 2024 | $8,295 | $136,935 | $22,388 | $114,547 |
| 2023 | -- | $128,674 | $21,037 | $107,637 |
| 2022 | $0 | $124,503 | $20,458 | $104,045 |
| 2021 | -- | $119,427 | $19,624 | $99,803 |
| 2020 | $0 | $119,427 | $19,624 | $99,803 |
| 2019 | $8,229 | $117,500 | $19,307 | $98,193 |
| 2018 | $8,229 | $128,379 | $18,865 | $109,514 |
| 2017 | $8,215 | $127,829 | $18,784 | $109,045 |
| 2016 | $7,129 | $125,323 | $18,416 | $106,907 |
| 2015 | $6,632 | $114,577 | $16,837 | $97,740 |
| 2014 | $6,185 | $112,166 | $16,483 | $95,683 |
| 2013 | $6,161 | $106,360 | $14,467 | $91,893 |
| 2011 | $6,131 | $106,360 | $14,467 | $91,893 |
Source: Public Records
Map
Nearby Homes
- 3415 Lincoln Trail
- 1798 E 1685 Rd N
- 1725 Il Route 48
- 524 Lakeside Dr
- 7 Brantley Ct
- 12 Wedgewood Ct
- 3508 Roosevelt Rd
- 3418 Kennedy Rd
- 703 Glenhill Rd
- 1211 N 1600 Rd E
- 0 N 1400 Rd E
- 0 Illinois 29
- 1918 Greenview
- 117 S Pershing Ave
- County Rd 2000 E
- E 1350 North Rd
- 1221 E Park St
- 2419 Eastwood Dr
- 810 N Snodgrass St
- 910 E Heights Ave
- 1695 E 1500 Rd N
- 1699 E 1500 North Rd
- 1677 E 1500 North Rd
- 1683 E 1500 North Rd
- 1703 E 1500 North Rd
- 1703 E 1500 North Rd
- 1704 E 1500 North Rd
- 1669 E 1500 North Rd
- 1714 E 1500 North Rd
- 1661 E 1500 North Rd
- 1535 N 1725 East Rd
- 1475 N 1700 East Rd
- 1719 E 1550 North Rd
- 1474 N 1650 East Rd
- 1650 E 1600 North Rd
- 1643 E 1450 North Rd
- 1524 N 1600 East Rd
- 1510 N 1600 East Rd
- 1629 E 1450 North Rd
- 1752 E 1450 North Rd