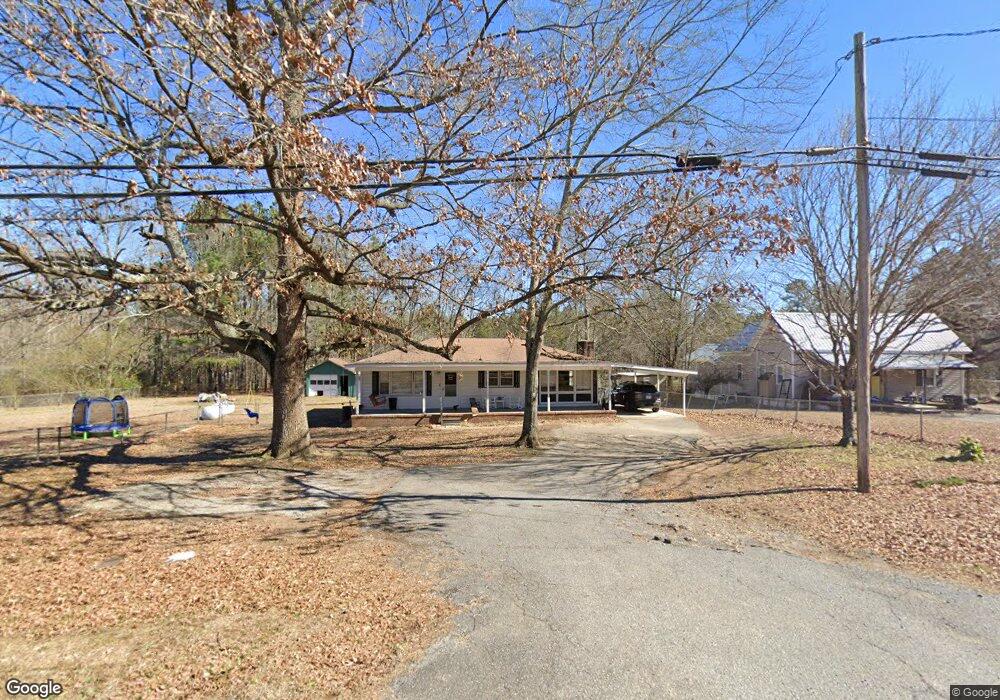
1696 Floyd Springs Rd NE Armuchee, GA 30105
Estimated Value: $196,709 - $244,000
--
Bed
--
Bath
1,724
Sq Ft
$132/Sq Ft
Est. Value
About This Home
This home is located at 1696 Floyd Springs Rd NE, Armuchee, GA 30105 and is currently estimated at $228,427, approximately $132 per square foot. 1696 Floyd Springs Rd NE is a home located in Floyd County with nearby schools including Armuchee Middle School and Armuchee High School.
Ownership History
Date
Name
Owned For
Owner Type
Purchase Details
Closed on
Jan 14, 2025
Sold by
Cja Properties Llc
Bought by
Langford Chris and Langford Julie
Current Estimated Value
Home Financials for this Owner
Home Financials are based on the most recent Mortgage that was taken out on this home.
Original Mortgage
$120,000
Outstanding Balance
$119,152
Interest Rate
6.72%
Mortgage Type
New Conventional
Estimated Equity
$109,275
Purchase Details
Closed on
Jun 17, 2014
Sold by
Carpenter George Riley
Bought by
Dunaway Jamie L
Purchase Details
Closed on
Jun 2, 2010
Sold by
Chapman William Fred
Bought by
Carpenter George Riley
Purchase Details
Closed on
Feb 6, 1998
Sold by
Carpenter Geoerge Riley and Carpe Pamela C
Bought by
Chapman William Fred
Purchase Details
Closed on
Aug 19, 1983
Sold by
Rountree Alton J Rountree Alton J
Bought by
Carpenter Geoerge Riley and Carpenter Pamela C
Purchase Details
Closed on
Jan 1, 1960
Bought by
Rountree Alton J Rountree Alton J
Create a Home Valuation Report for This Property
The Home Valuation Report is an in-depth analysis detailing your home's value as well as a comparison with similar homes in the area
Home Values in the Area
Average Home Value in this Area
Purchase History
| Date | Buyer | Sale Price | Title Company |
|---|---|---|---|
| Langford Chris | -- | -- | |
| Dunaway Jamie L | $74,000 | -- | |
| Carpenter George Riley | -- | -- | |
| Carpenter George Riley | -- | -- | |
| Chapman William Fred | -- | -- | |
| Carpenter Geoerge Riley | $22,500 | -- | |
| Rountree Alton J Rountree Alton J | -- | -- |
Source: Public Records
Mortgage History
| Date | Status | Borrower | Loan Amount |
|---|---|---|---|
| Open | Langford Chris | $120,000 |
Source: Public Records
Tax History Compared to Growth
Tax History
| Year | Tax Paid | Tax Assessment Tax Assessment Total Assessment is a certain percentage of the fair market value that is determined by local assessors to be the total taxable value of land and additions on the property. | Land | Improvement |
|---|---|---|---|---|
| 2024 | $2,243 | $68,244 | $9,456 | $58,788 |
| 2023 | $1,826 | $63,688 | $8,343 | $55,345 |
| 2022 | $1,571 | $52,941 | $6,674 | $46,267 |
| 2021 | $1,327 | $43,951 | $6,674 | $37,277 |
| 2020 | $1,234 | $40,541 | $5,284 | $35,257 |
| 2019 | $1,079 | $35,920 | $5,284 | $30,636 |
| 2018 | $1,025 | $34,061 | $5,284 | $28,777 |
| 2017 | $993 | $32,923 | $5,284 | $27,639 |
| 2016 | $895 | $29,320 | $5,280 | $24,040 |
| 2015 | -- | $29,320 | $5,280 | $24,040 |
| 2014 | -- | $29,320 | $5,280 | $24,040 |
Source: Public Records
Map
Nearby Homes
- 1603 Floyd Springs Rd NE
- 1465 Turner Rd NE
- 1194 New Rosedale Rd NE
- 1085 New Rosedale Rd NE
- 1024 New Rosedale Rd NE
- 311 Herring Rd NE
- 2324 Floyd Springs Rd NE
- 334 Armuchee Trail NE
- 201 Kellett Rd NE
- 282 Turner Rd NE
- 46 North Dr
- 4569 Old Dalton Rd NE
- 0 Highway 140 Unit 20164671
- 5452 Old Dalton Rd NE
- 70 Old Summerville Rd
- 2888 Old Summerville Rd
- 1434 Culpepper Rd NE
- 4494 Old Summerville Rd
- 266 W Troutman Rd NE
- 418 Dunaway Gap Rd
- 1688 Floyd Springs Rd NE
- 1718 Floyd Springs Rd NE
- 1718 Floyd Springs Rd NE
- 1767 Floyd Springs Rd NE
- 1781 Floyd Springs Rd NE
- 1725 Floyd Springs Rd NE
- 1807 Floyd Springs Rd NE
- 1735 Floyd Springs Rd NE
- 1735 Floyd Springs Rd NE
- 1774 Floyd Springs Rd NE
- 1774 Floyd Springs Rd NE
- 1691 Floyd Springs Rd NE
- 1790 Floyd Springs Rd NE
- 1683 Floyd Springs Rd NE
- 1812 Floyd Springs Rd NE
- 1830 Floyd Springs Rd NE
- 1832 Floyd Springs Rd NE
- 119 Crackerneck Rd NE
- 1641 Floyd Springs Rd NE
- 1532 Turner Rd NE