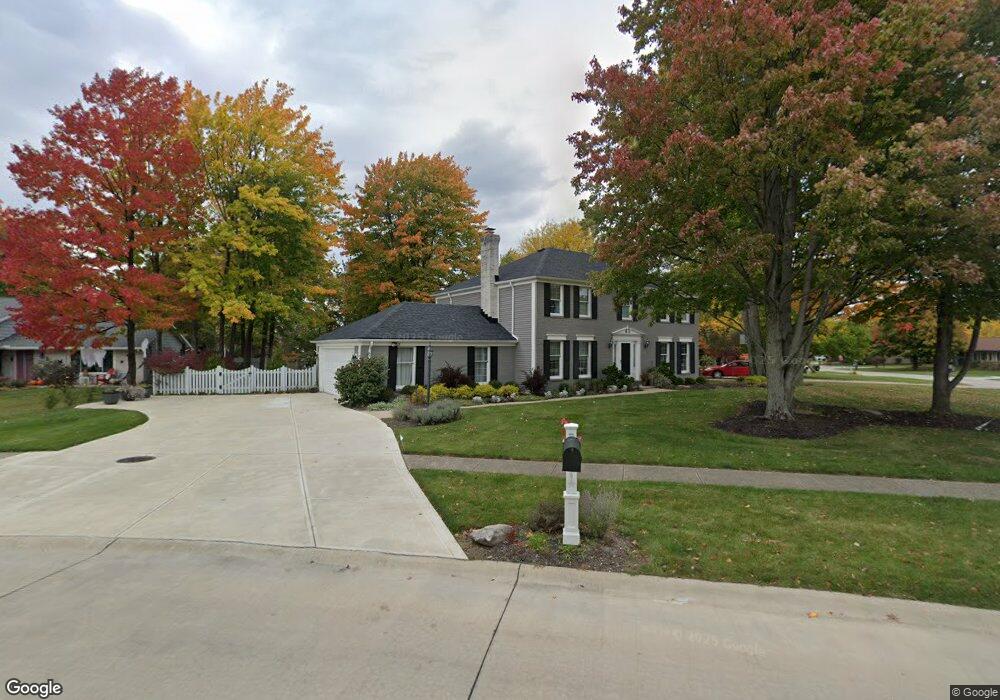
16969 Stag Thicket Ln Strongsville, OH 44136
Estimated Value: $362,000 - $403,000
4
Beds
3
Baths
2,422
Sq Ft
$158/Sq Ft
Est. Value
About This Home
This home is located at 16969 Stag Thicket Ln, Strongsville, OH 44136 and is currently estimated at $382,960, approximately $158 per square foot. 16969 Stag Thicket Ln is a home located in Cuyahoga County with nearby schools including Strongsville High School and Sts Joseph & John Interparochial School.
Ownership History
Date
Name
Owned For
Owner Type
Purchase Details
Closed on
Nov 16, 2016
Sold by
Potoczak Christine A and Potoczak Leonard S
Bought by
Potoczak Christine A
Current Estimated Value
Purchase Details
Closed on
Aug 10, 1988
Sold by
Truesdale David J and Truesdale Joan T
Bought by
Potoczak Leonard S
Purchase Details
Closed on
Jan 24, 1986
Sold by
Kinder Thomas F
Bought by
Truesdale David J and Truesdale Joan T
Purchase Details
Closed on
Sep 29, 1983
Sold by
Helbling Robert J
Bought by
Kinder Thomas F
Purchase Details
Closed on
Mar 25, 1981
Sold by
Eileen Neuber
Bought by
Helbling Robert J
Purchase Details
Closed on
Feb 13, 1981
Sold by
Neuber Bernard G
Bought by
Eileen Neuber
Purchase Details
Closed on
Jun 2, 1978
Sold by
Francher John W
Bought by
Neuber Bernard G
Purchase Details
Closed on
Jun 11, 1976
Bought by
Francher John W
Purchase Details
Closed on
Jan 1, 1976
Bought by
Production Homes Inc
Create a Home Valuation Report for This Property
The Home Valuation Report is an in-depth analysis detailing your home's value as well as a comparison with similar homes in the area
Home Values in the Area
Average Home Value in this Area
Purchase History
| Date | Buyer | Sale Price | Title Company |
|---|---|---|---|
| Potoczak Christine A | -- | None Available | |
| Potoczak Leonard S | $126,000 | -- | |
| Truesdale David J | $108,000 | -- | |
| Kinder Thomas F | $105,000 | -- | |
| Helbling Robert J | $96,900 | -- | |
| Eileen Neuber | -- | -- | |
| Neuber Bernard G | $93,000 | -- | |
| Francher John W | $72,000 | -- | |
| Production Homes Inc | -- | -- |
Source: Public Records
Tax History Compared to Growth
Tax History
| Year | Tax Paid | Tax Assessment Tax Assessment Total Assessment is a certain percentage of the fair market value that is determined by local assessors to be the total taxable value of land and additions on the property. | Land | Improvement |
|---|---|---|---|---|
| 2024 | $5,323 | $113,365 | $21,840 | $91,525 |
| 2023 | $5,253 | $83,900 | $18,450 | $65,450 |
| 2022 | $5,215 | $83,900 | $18,450 | $65,450 |
| 2021 | $5,174 | $83,900 | $18,450 | $65,450 |
| 2020 | $4,795 | $68,780 | $15,120 | $53,660 |
| 2019 | $4,654 | $196,500 | $43,200 | $153,300 |
| 2018 | $4,181 | $68,780 | $15,120 | $53,660 |
| 2017 | $4,215 | $63,530 | $12,180 | $51,350 |
| 2016 | $4,180 | $63,530 | $12,180 | $51,350 |
| 2015 | $4,138 | $63,530 | $12,180 | $51,350 |
| 2014 | $4,239 | $63,530 | $12,180 | $51,350 |
Source: Public Records
Map
Nearby Homes
- 17024 Bear Creek Ln
- 18294 Drake Rd
- 17682 Drake Rd
- 17934 Cambridge Oval
- 18162 Fawn Cir
- 17159 Turkey Meadow Ln
- 18411 Yorktown Oval
- 17259 Woodshire Dr
- 19297 Lauren Way
- 19311 Bradford Ct
- 16650 Lanier Ave
- 18630 Shurmer Rd
- 16486 S Red Rock Dr
- 20393 Wildwood Ln
- 18848 Pearl Rd
- 16450 Howe Rd
- 17130 Golden Star Dr
- 19908 Stoughton Dr
- 19513 Lunn Rd
- 20114 Drake Rd
- 16971 Stag Thicket Ln
- 16857 Rabbit Run Dr
- 16973 Stag Thicket Ln
- 16872 Rabbit Run Dr
- 17165 Rabbit Run Dr
- 16865 Rabbit Run Dr
- 17166 Rabbit Run Dr
- 16950 Deer Path Dr
- 16948 Deer Path Dr
- 16952 Stag Thicket Ln
- 16968 Stag Thicket Ln
- 16873 Rabbit Run Dr
- 17158 Rabbit Run Dr
- 16946 Deer Path Dr
- 17157 Rabbit Run Dr
- 16880 Rabbit Run Dr
- 16944 Deer Path Dr
- 16970 Stag Thicket Ln
- 16881 Rabbit Run Dr
- 16942 Deer Path Dr