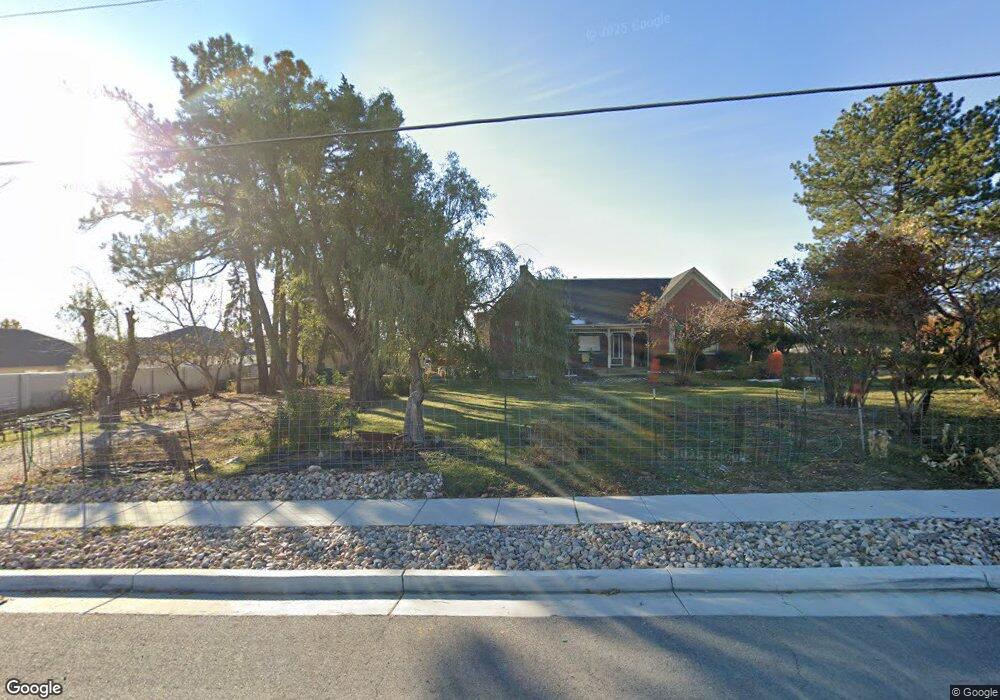
1697 N Fort Ln Layton, UT 84041
Estimated Value: $526,497 - $609,000
4
Beds
2
Baths
1,986
Sq Ft
$290/Sq Ft
Est. Value
About This Home
This home is located at 1697 N Fort Ln, Layton, UT 84041 and is currently estimated at $576,124, approximately $290 per square foot. 1697 N Fort Ln is a home located in Davis County with nearby schools including Sarah Jane Adams Elementary School, North Layton Junior High School, and Northridge High School.
Ownership History
Date
Name
Owned For
Owner Type
Purchase Details
Closed on
Nov 6, 2018
Sold by
Gatherum Doneta Mcgonigle and The Ralph Stanley Gatherum And
Bought by
Layton City
Current Estimated Value
Purchase Details
Closed on
Jul 15, 2002
Sold by
Gatherum Ralph Stanley and Gatherum Doneta Mcgonigle
Bought by
Gatherum Ralph Stanley and Gatherum Doneta Mcgonigle
Purchase Details
Closed on
Apr 13, 2000
Sold by
Gatherum Ralph Stanley and Gatherum Doneta Mcgonigle
Bought by
Gatherum Ralph Stanley and Gatherum Doneta Mcgonigle
Home Financials for this Owner
Home Financials are based on the most recent Mortgage that was taken out on this home.
Original Mortgage
$21,000
Interest Rate
8.26%
Purchase Details
Closed on
Jan 29, 1998
Sold by
Gatherum Doneta Mcgonigle and Gatherum Doneta M
Bought by
Gatherum Ralph Stanley and Gatherum Doneta Mcgonigle
Create a Home Valuation Report for This Property
The Home Valuation Report is an in-depth analysis detailing your home's value as well as a comparison with similar homes in the area
Home Values in the Area
Average Home Value in this Area
Purchase History
| Date | Buyer | Sale Price | Title Company |
|---|---|---|---|
| Layton City | -- | None Available | |
| Gatherum Ralph Stanley | -- | Founders Title Co | |
| Gatherum Ralph Stanley | -- | Founders Title Co | |
| Gatherum Ralph Stanley | -- | Founders Title Co | |
| Gatherum Ralph Stanley | -- | Founders Title Co | |
| Gatherum Ralph Stanley | -- | -- |
Source: Public Records
Mortgage History
| Date | Status | Borrower | Loan Amount |
|---|---|---|---|
| Previous Owner | Gatherum Ralph Stanley | $21,000 |
Source: Public Records
Tax History Compared to Growth
Tax History
| Year | Tax Paid | Tax Assessment Tax Assessment Total Assessment is a certain percentage of the fair market value that is determined by local assessors to be the total taxable value of land and additions on the property. | Land | Improvement |
|---|---|---|---|---|
| 2025 | $2,238 | $234,861 | $117,710 | $117,151 |
| 2024 | $2,161 | $228,527 | $133,125 | $95,402 |
| 2023 | $1,980 | $2,873,395 | $2,691,365 | $182,030 |
| 2022 | $2,014 | $1,451,952 | $1,352,476 | $99,476 |
| 2021 | $2,031 | $2,061,967 | $1,922,999 | $138,968 |
| 2020 | $1,837 | $1,755,407 | $1,625,886 | $129,521 |
| 2019 | $1,730 | $1,659,132 | $1,534,624 | $124,508 |
| 2018 | $1,585 | $1,640,894 | $1,534,624 | $106,270 |
| 2016 | $1,542 | $113,260 | $45,568 | $67,692 |
| 2015 | $1,554 | $108,400 | $45,568 | $62,832 |
| 2014 | $1,525 | $108,713 | $45,881 | $62,832 |
| 2013 | -- | $95,981 | $33,205 | $62,776 |
Source: Public Records
Map
Nearby Homes
- 1553 N 250 E
- 1474 N 285 E
- 324 E 1325 N
- 1583 N 25 E
- 1490 N 175 W
- 103 W 1275 N
- 1180 N 100 E
- 1908 N 200 W
- 2044 Evans Cove Loop
- 2048 Evans Cove Loop
- 9 W 2150 N
- 23 E 2150 N
- 2053 Evans Cove Loop Unit 39
- 979 E Frost Way
- 3450 N Fairfield Rd Unit 3
- 937 Rainbow Dr
- 398 Paul Ave
- 1096 N 300 W
- 1837 N 440 W
- 983 E Antelope Dr