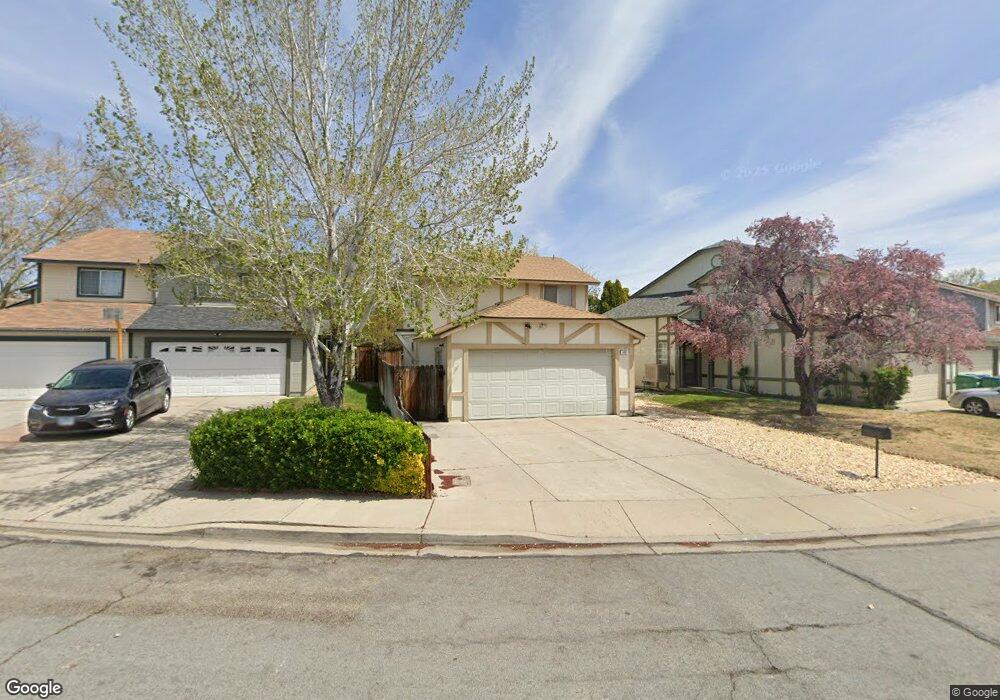
1697 Round Mountain Cir Sparks, NV 89434
Reed NeighborhoodEstimated Value: $394,726 - $443,000
3
Beds
3
Baths
1,392
Sq Ft
$305/Sq Ft
Est. Value
About This Home
This home is located at 1697 Round Mountain Cir, Sparks, NV 89434 and is currently estimated at $425,182, approximately $305 per square foot. 1697 Round Mountain Cir is a home located in Washoe County with nearby schools including Lloyd Diedrichsen Elementary School, Lou Mendive Middle School, and Edward C Reed High School.
Ownership History
Date
Name
Owned For
Owner Type
Purchase Details
Closed on
Feb 10, 2012
Sold by
Jones Sharlene S L
Bought by
Lighthouse Mountain Llc
Current Estimated Value
Purchase Details
Closed on
Nov 9, 2011
Sold by
Jones Sharlene S L
Bought by
Jones Sharlene S L
Purchase Details
Closed on
Aug 27, 2008
Sold by
Chun Irene S K
Bought by
Chun Irene S K and The 2008 Irene Chun Family Trust
Purchase Details
Closed on
Sep 23, 1997
Sold by
Marsden Mitchell F and Marsden Maribeth
Bought by
Chun Claude W C and Chun Irene S K
Home Financials for this Owner
Home Financials are based on the most recent Mortgage that was taken out on this home.
Original Mortgage
$96,000
Interest Rate
7.54%
Create a Home Valuation Report for This Property
The Home Valuation Report is an in-depth analysis detailing your home's value as well as a comparison with similar homes in the area
Home Values in the Area
Average Home Value in this Area
Purchase History
| Date | Buyer | Sale Price | Title Company |
|---|---|---|---|
| Lighthouse Mountain Llc | -- | None Available | |
| Jones Sharlene S L | -- | None Available | |
| Chun Irene S K | -- | None Available | |
| Chun Claude W C | $120,000 | United Title |
Source: Public Records
Mortgage History
| Date | Status | Borrower | Loan Amount |
|---|---|---|---|
| Previous Owner | Chun Claude W C | $96,000 |
Source: Public Records
Tax History Compared to Growth
Tax History
| Year | Tax Paid | Tax Assessment Tax Assessment Total Assessment is a certain percentage of the fair market value that is determined by local assessors to be the total taxable value of land and additions on the property. | Land | Improvement |
|---|---|---|---|---|
| 2026 | -- | $67,344 | $33,201 | $34,143 |
| 2025 | $1,817 | $67,672 | $32,508 | $35,164 |
| 2024 | $1,817 | $65,690 | $29,894 | $35,797 |
| 2023 | $1,763 | $65,902 | $31,658 | $34,245 |
| 2022 | $1,714 | $52,908 | $24,066 | $28,842 |
| 2021 | $1,663 | $48,593 | $19,562 | $29,031 |
| 2020 | $1,563 | $48,004 | $18,648 | $29,356 |
| 2019 | $1,489 | $47,248 | $18,648 | $28,600 |
| 2018 | $1,421 | $41,237 | $13,010 | $28,227 |
| 2017 | $1,364 | $40,842 | $12,348 | $28,494 |
| 2016 | $1,330 | $40,346 | $11,025 | $29,321 |
| 2015 | $337 | $38,774 | $9,293 | $29,481 |
| 2014 | $1,287 | $36,563 | $8,127 | $28,436 |
| 2013 | -- | $34,414 | $6,174 | $28,240 |
Source: Public Records
Map
Nearby Homes
- 1675 Round Mountain Cir
- 2688 Laguna Way
- 3127 Montezuma Way
- 3222 Myles Dr
- 2252 Sycamore Glen Dr
- 2407 Sunny Slope Dr Unit 1
- 3345 Groom Way
- 2679 Sycamore Glen Dr Unit 4
- 1770 Burnside Dr
- 1990 Fargo Way
- 2159 Meritage Dr
- 2119 Avella Dr
- 2535 Tuscan Way
- 1280 O'Callaghan Dr
- 1029 Baywood Dr Unit D
- 1960 Vicenza Dr
- 1757 Bluehaven Dr
- 1069 Palmwood Dr
- 1290 Highgate Ct
- 2002 Wabash Cir
- 1695 Round Mountain Cir
- 1711 Round Mountain Cir
- 1693 Round Mountain Cir
- 1715 Round Mountain Cir
- 1704 Ashley Park Ct
- 1717 Round Mountain Cir
- 1702 Ashley Park Ct
- 1691 Round Mountain Cir
- 1706 Ashley Park Ct
- 1689 Round Mountain Cir
- 1719 Round Mountain Cir
- 1702 Round Mountain Cir
- 1700 Round Mountain Cir
- 1698 Round Mountain Cir
- 1696 Round Mountain Cir
- 1708 Ashley Park Ct
- 1704 Round Mountain Cir
- 1694 Round Mountain Cir
- 1692 Round Mountain Cir
- 1649 Fieldcrest Dr