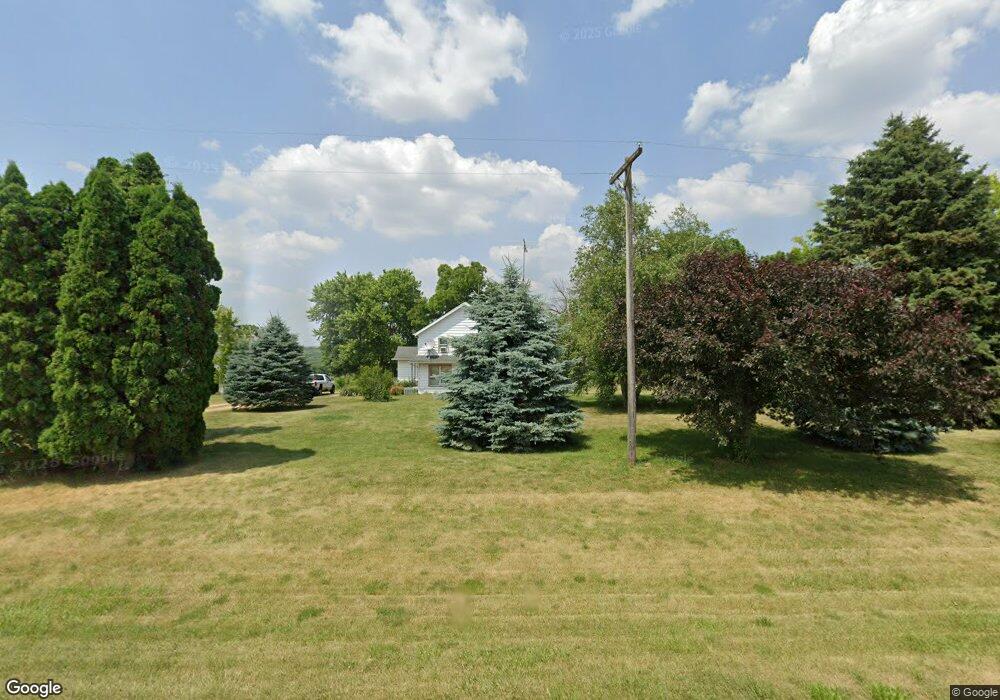
16976 W Lanark Rd Forreston, IL 61030
Estimated Value: $207,000 - $337,000
--
Bed
--
Bath
1,776
Sq Ft
$156/Sq Ft
Est. Value
About This Home
This home is located at 16976 W Lanark Rd, Forreston, IL 61030 and is currently estimated at $277,579, approximately $156 per square foot. 16976 W Lanark Rd is a home located in Ogle County with nearby schools including Forreston High School.
Create a Home Valuation Report for This Property
The Home Valuation Report is an in-depth analysis detailing your home's value as well as a comparison with similar homes in the area
Home Values in the Area
Average Home Value in this Area
Tax History Compared to Growth
Tax History
| Year | Tax Paid | Tax Assessment Tax Assessment Total Assessment is a certain percentage of the fair market value that is determined by local assessors to be the total taxable value of land and additions on the property. | Land | Improvement |
|---|---|---|---|---|
| 2024 | $2,970 | $71,281 | $17,531 | $53,750 |
| 2023 | $3,048 | $66,487 | $16,352 | $50,135 |
| 2022 | $3,106 | $60,835 | $14,962 | $45,873 |
| 2021 | $3,140 | $59,317 | $14,589 | $44,728 |
| 2020 | $3,131 | $58,268 | $14,331 | $43,937 |
| 2019 | $3,190 | $55,893 | $13,747 | $42,146 |
| 2018 | $3,600 | $55,893 | $13,747 | $42,146 |
| 2017 | $3,298 | $55,893 | $13,747 | $42,146 |
| 2016 | $3,493 | $54,567 | $13,421 | $41,146 |
| 2015 | $2,971 | $53,288 | $13,106 | $40,182 |
| 2014 | $3,429 | $49,013 | $8,831 | $40,182 |
| 2013 | $3,537 | $50,234 | $9,051 | $41,183 |
Source: Public Records
Map
Nearby Homes
- 10225 N Brookville Rd
- 406 W Balsam St
- 304 Maple Ave
- 411 S Walnut Ave
- 404 E Willow St
- 603 E Hewitt St
- 601 Hewitt St
- 603 Hewitt St
- 31457 Straw School Rd
- 97 Highcrest Ct
- 613 & 615 Hewitt St
- 617 & 619 Hewitt St
- 609 & 611 Hewitt St
- 605 & 607 Hewitt St
- 701 Hewitt St
- 703 Hewitt St
- 702 Hewitt St
- 706 Hewitt St
- 13 S Stanton St
- 609 S Cedar St