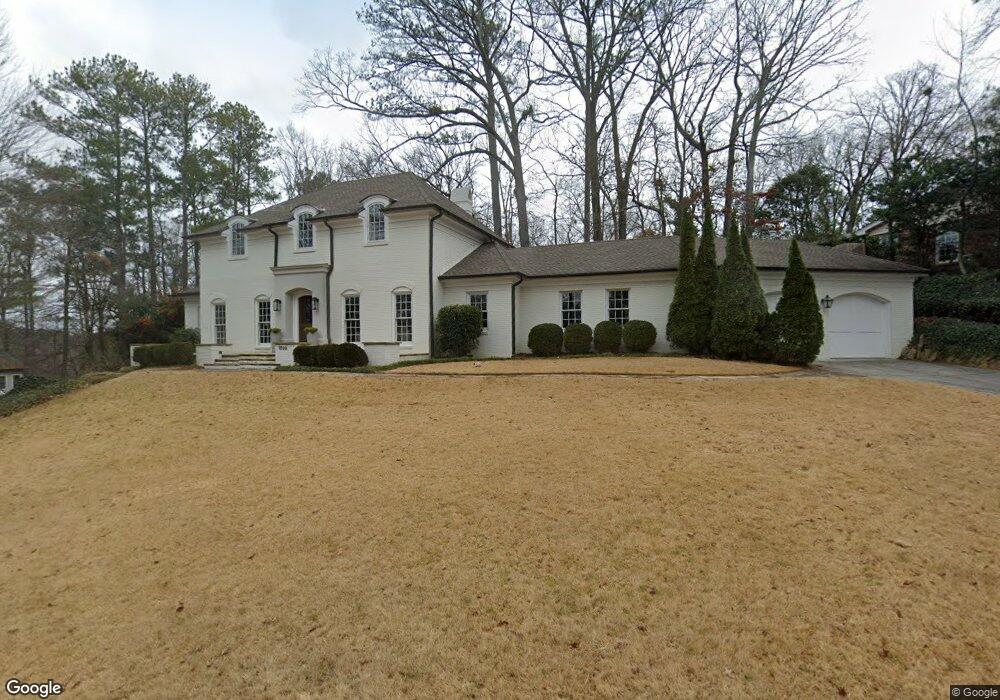
1698 Fernleaf Cir NW Unit 7 Atlanta, GA 30318
Estimated Value: $784,000 - $859,290
3
Beds
3
Baths
1,960
Sq Ft
$414/Sq Ft
Est. Value
About This Home
This home is located at 1698 Fernleaf Cir NW Unit 7, Atlanta, GA 30318 and is currently estimated at $811,323, approximately $413 per square foot. 1698 Fernleaf Cir NW Unit 7 is a home located in Fulton County with nearby schools including Brandon Elementary School, Sutton Middle School, and North Atlanta High School.
Ownership History
Date
Name
Owned For
Owner Type
Purchase Details
Closed on
May 30, 2006
Sold by
Higley Scott D
Bought by
Patton Cody A and Patton Polly W
Current Estimated Value
Home Financials for this Owner
Home Financials are based on the most recent Mortgage that was taken out on this home.
Original Mortgage
$336,000
Outstanding Balance
$195,042
Interest Rate
6.44%
Mortgage Type
New Conventional
Estimated Equity
$616,281
Purchase Details
Closed on
Aug 18, 2003
Sold by
Buitragoo Felix G
Bought by
Coursey David H
Home Financials for this Owner
Home Financials are based on the most recent Mortgage that was taken out on this home.
Original Mortgage
$39,900
Interest Rate
5.72%
Mortgage Type
Stand Alone Refi Refinance Of Original Loan
Purchase Details
Closed on
May 2, 1994
Sold by
Hiles Thomas C Tami J
Bought by
Buitrago Felix G
Home Financials for this Owner
Home Financials are based on the most recent Mortgage that was taken out on this home.
Original Mortgage
$110,000
Interest Rate
8.48%
Create a Home Valuation Report for This Property
The Home Valuation Report is an in-depth analysis detailing your home's value as well as a comparison with similar homes in the area
Home Values in the Area
Average Home Value in this Area
Purchase History
| Date | Buyer | Sale Price | Title Company |
|---|---|---|---|
| Patton Cody A | $420,000 | -- | |
| Coursey David H | $399,000 | -- | |
| Buitrago Felix G | $150,000 | -- |
Source: Public Records
Mortgage History
| Date | Status | Borrower | Loan Amount |
|---|---|---|---|
| Open | Patton Cody A | $336,000 | |
| Previous Owner | Coursey David H | $39,900 | |
| Previous Owner | Coursey David H | $319,200 | |
| Previous Owner | Buitrago Felix G | $110,000 |
Source: Public Records
Tax History Compared to Growth
Tax History
| Year | Tax Paid | Tax Assessment Tax Assessment Total Assessment is a certain percentage of the fair market value that is determined by local assessors to be the total taxable value of land and additions on the property. | Land | Improvement |
|---|---|---|---|---|
| 2025 | $8,096 | $380,360 | $82,840 | $297,520 |
| 2023 | $14,836 | $358,360 | $96,680 | $261,680 |
| 2022 | $8,566 | $277,080 | $78,400 | $198,680 |
| 2021 | $8,264 | $268,960 | $76,080 | $192,880 |
| 2020 | $6,342 | $227,440 | $77,520 | $149,920 |
| 2019 | $518 | $220,320 | $88,360 | $131,960 |
| 2018 | $7,434 | $236,440 | $35,520 | $200,920 |
| 2017 | $5,475 | $167,240 | $59,880 | $107,360 |
| 2016 | $5,471 | $167,240 | $59,880 | $107,360 |
| 2015 | $5,706 | $193,360 | $59,880 | $133,480 |
| 2014 | $5,270 | $155,640 | $48,200 | $107,440 |
Source: Public Records
Map
Nearby Homes
- 2632 Defoors Ferry Rd NW
- 2556 Defoors Ferry Rd NW
- 2461 Fernleaf Ct NW
- 11 Palace Green Place NW
- 2 Scotland Place NW Unit 162
- 12 Palace Green Place NW
- 3 Market Square Place NW
- 10 Newport Place NW Unit 271
- 1 N Boundary Place NW
- 10 Market Square Place NW Unit 243
- 2 Market Square Place NW
- 1184 Liberty Pkwy NW
- 1293 Liberty Pkwy NW
- 1208 Liberty Pkwy NW Unit 908
- 1228 Liberty Pkwy NW Unit 903
- 1168 Liberty Pkwy NW
- 1153 Liberty Pkwy NW
- 1049 Brandsford St NW Unit 27-01
- 2038 Liberty Ct NW
- 1676 Fernleaf Cir NW Unit 7
- 1710 Fernleaf Cir NW
- 1664 Fernleaf Cir NW
- 1718 Fernleaf Cir NW
- 1687 Fernleaf Cir NW Unit 30%
- 1687 Fernleaf Cir NW
- 1681 Fernleaf Cir NW
- 1711 Fernleaf Cir NW
- 1675 Fernleaf Cir NW
- 1705 Fernleaf Cir NW
- 1693 Fernleaf Cir NW
- 1656 Fernleaf Cir NW
- 1704 Fernleaf Cir NW
- 1667 Fernleaf Cir NW
- 1723 Fernleaf Cir NW
- 1722 Fernleaf Cir NW
- 1689 Fernleaf Cir NW
- 1648 Fernleaf Cir NW
- 1708 Fernleaf Cir NW