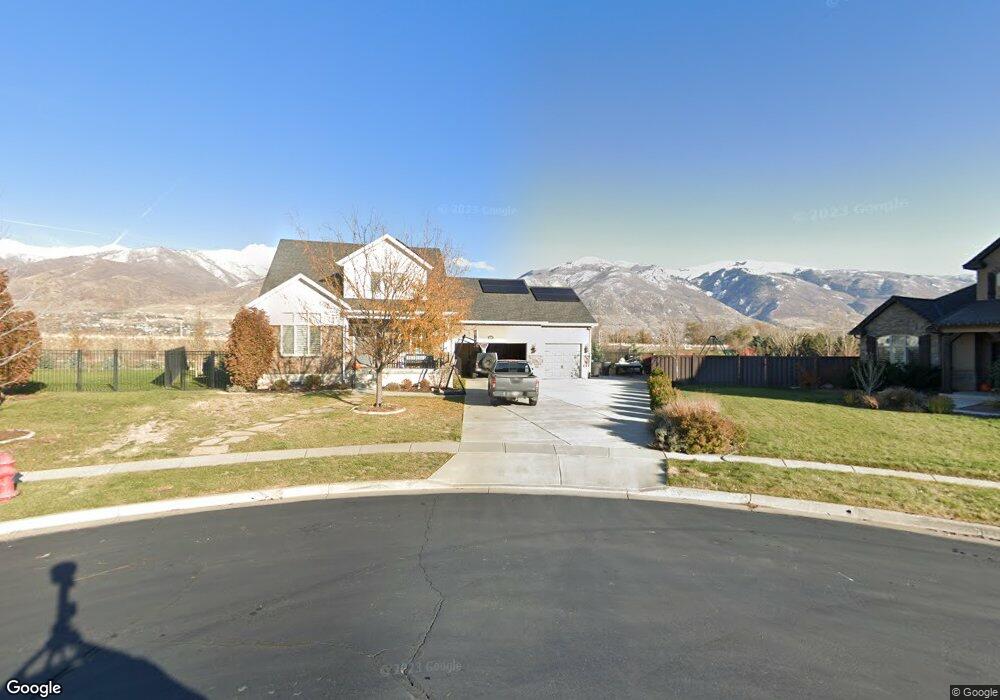
1698 W 600 N Farmington, UT 84025
Estimated Value: $741,000 - $851,348
4
Beds
3
Baths
3,818
Sq Ft
$209/Sq Ft
Est. Value
About This Home
This home is located at 1698 W 600 N, Farmington, UT 84025 and is currently estimated at $796,337, approximately $208 per square foot. 1698 W 600 N is a home located in Davis County with nearby schools including Canyon Creek Elementary, Farmington High, and Farmington Junior High School.
Ownership History
Date
Name
Owned For
Owner Type
Purchase Details
Closed on
Jun 24, 2019
Sold by
Buchmiller Steven and Buchmiller Abigail
Bought by
Buchmiller Steven C
Current Estimated Value
Home Financials for this Owner
Home Financials are based on the most recent Mortgage that was taken out on this home.
Original Mortgage
$416,000
Outstanding Balance
$365,024
Interest Rate
4%
Mortgage Type
New Conventional
Estimated Equity
$431,313
Purchase Details
Closed on
Jul 22, 2013
Sold by
Destination Homes Inc
Bought by
Buchmiller Steven and Buchmiller Abigail
Home Financials for this Owner
Home Financials are based on the most recent Mortgage that was taken out on this home.
Original Mortgage
$389,748
Interest Rate
4.25%
Mortgage Type
FHA
Purchase Details
Closed on
Apr 17, 2013
Sold by
Sli Commercial Real Estate Co
Bought by
Destination Homes Llc
Create a Home Valuation Report for This Property
The Home Valuation Report is an in-depth analysis detailing your home's value as well as a comparison with similar homes in the area
Home Values in the Area
Average Home Value in this Area
Purchase History
| Date | Buyer | Sale Price | Title Company |
|---|---|---|---|
| Buchmiller Steven C | -- | Stewart Title Ins Agency | |
| Buchmiller Steven | -- | Bonneville Superior Title Co | |
| Destination Homes Llc | -- | Bonneville Superior Title |
Source: Public Records
Mortgage History
| Date | Status | Borrower | Loan Amount |
|---|---|---|---|
| Open | Buchmiller Steven C | $416,000 | |
| Closed | Buchmiller Steven | $389,748 |
Source: Public Records
Tax History Compared to Growth
Tax History
| Year | Tax Paid | Tax Assessment Tax Assessment Total Assessment is a certain percentage of the fair market value that is determined by local assessors to be the total taxable value of land and additions on the property. | Land | Improvement |
|---|---|---|---|---|
| 2024 | $4,087 | $408,650 | $168,704 | $239,946 |
| 2023 | $3,930 | $716,000 | $269,549 | $446,451 |
| 2022 | $3,918 | $405,350 | $147,641 | $257,709 |
| 2021 | $3,571 | $550,000 | $157,785 | $392,215 |
| 2020 | $3,150 | $473,000 | $151,282 | $321,718 |
| 2019 | $3,103 | $452,000 | $168,635 | $283,365 |
| 2018 | $2,912 | $418,000 | $152,528 | $265,472 |
| 2016 | $2,929 | $216,370 | $59,131 | $157,239 |
| 2015 | $2,814 | $197,340 | $59,131 | $138,209 |
| 2014 | $2,512 | $180,991 | $49,463 | $131,528 |
| 2013 | -- | $85,626 | $85,626 | $0 |
Source: Public Records
Map
Nearby Homes
- 556 Innovator Dr Unit 158
- 562 Innovator Dr Unit 155
- 1488 W Kiera Ct Unit 148
- 1484 W Kiera Ct Unit 146
- 1472 W Cook Ln Unit 164
- 604 Sego Way Unit 220
- 604 Sego Way Unit 207
- 597 N Nichole Ln Unit 205
- Live-Work Townhomes Plan at Station Park
- Grand Slam Plan at Station Park
- Major League + Basement Plan at Station Park
- Cabo + Basement Plan at Station Park
- Major League Roof Deck + Basement Plan at Station Park
- Grand Slam with Roof Deck Plan at Station Park
- 926 N 1875 W
- 1844 Country Bend Cir
- 2009 W Lonestar Dr
- Trio Plan at Eastridge Estates
- Treble Plan at Eastridge Estates
- Timpani Plan at Eastridge Estates