1698 Whisper Ridge Rd Ashton, ID 83420
Estimated Value: $2,300,000 - $2,776,221
5
Beds
6
Baths
8,670
Sq Ft
$293/Sq Ft
Est. Value
About This Home
This home is located at 1698 Whisper Ridge Rd, Ashton, ID 83420 and is currently estimated at $2,538,111, approximately $292 per square foot. 1698 Whisper Ridge Rd is a home located in Fremont County with nearby schools including Ashton Elementary School and North Fremont Junior/Senior High School.
Ownership History
Date
Name
Owned For
Owner Type
Purchase Details
Closed on
Mar 27, 2020
Sold by
Beverage William D
Bought by
Beverage William D and The William D Beverage Revocable Trust
Current Estimated Value
Purchase Details
Closed on
Sep 13, 2018
Sold by
Fmtr William and Fmtr Jolene
Bought by
Beverage William D
Purchase Details
Closed on
Mar 10, 2008
Sold by
Davidson Daniel B and Karlene Davidson T
Bought by
Fun Adventures Llc
Home Financials for this Owner
Home Financials are based on the most recent Mortgage that was taken out on this home.
Original Mortgage
$100,000
Interest Rate
5.41%
Mortgage Type
Seller Take Back
Purchase Details
Closed on
Jan 13, 2005
Sold by
Davidson Daniel B and Karlene Davidson T
Bought by
Davidson Daniel B and Karlene Davidson T
Home Financials for this Owner
Home Financials are based on the most recent Mortgage that was taken out on this home.
Original Mortgage
$260,000
Interest Rate
5.67%
Mortgage Type
Unknown
Create a Home Valuation Report for This Property
The Home Valuation Report is an in-depth analysis detailing your home's value as well as a comparison with similar homes in the area
Home Values in the Area
Average Home Value in this Area
Purchase History
| Date | Buyer | Sale Price | Title Company |
|---|---|---|---|
| Beverage William D | -- | None Available | |
| Beverage William D | -- | None Available | |
| Fun Adventures Llc | -- | -- | |
| Davidson Daniel B | -- | -- |
Source: Public Records
Mortgage History
| Date | Status | Borrower | Loan Amount |
|---|---|---|---|
| Closed | Fun Adventures Llc | $100,000 | |
| Previous Owner | Davidson Daniel B | $260,000 |
Source: Public Records
Tax History Compared to Growth
Tax History
| Year | Tax Paid | Tax Assessment Tax Assessment Total Assessment is a certain percentage of the fair market value that is determined by local assessors to be the total taxable value of land and additions on the property. | Land | Improvement |
|---|---|---|---|---|
| 2025 | $6,368 | $1,725,236 | $143,395 | $1,581,841 |
| 2024 | $6,368 | $1,785,840 | $143,395 | $1,642,445 |
| 2023 | $5,937 | $1,752,493 | $110,048 | $1,642,445 |
| 2022 | $8,074 | $1,359,599 | $92,284 | $1,267,315 |
| 2021 | $8,941 | $1,141,321 | $50,173 | $1,091,148 |
| 2020 | $9,276 | $1,105,065 | $50,173 | $1,054,892 |
| 2019 | $9,950 | $1,205,065 | $50,173 | $1,154,892 |
| 2018 | $8,723 | $998,499 | $50,173 | $948,326 |
| 2017 | $89 | $966,583 | $59,570 | $907,013 |
| 2016 | $8,893 | $988,082 | $81,069 | $907,013 |
| 2015 | $8,890 | $1,006,895 | $0 | $0 |
| 2014 | $7,382 | $967,263 | $0 | $0 |
| 2013 | $7,382 | $859,448 | $0 | $0 |
Source: Public Records
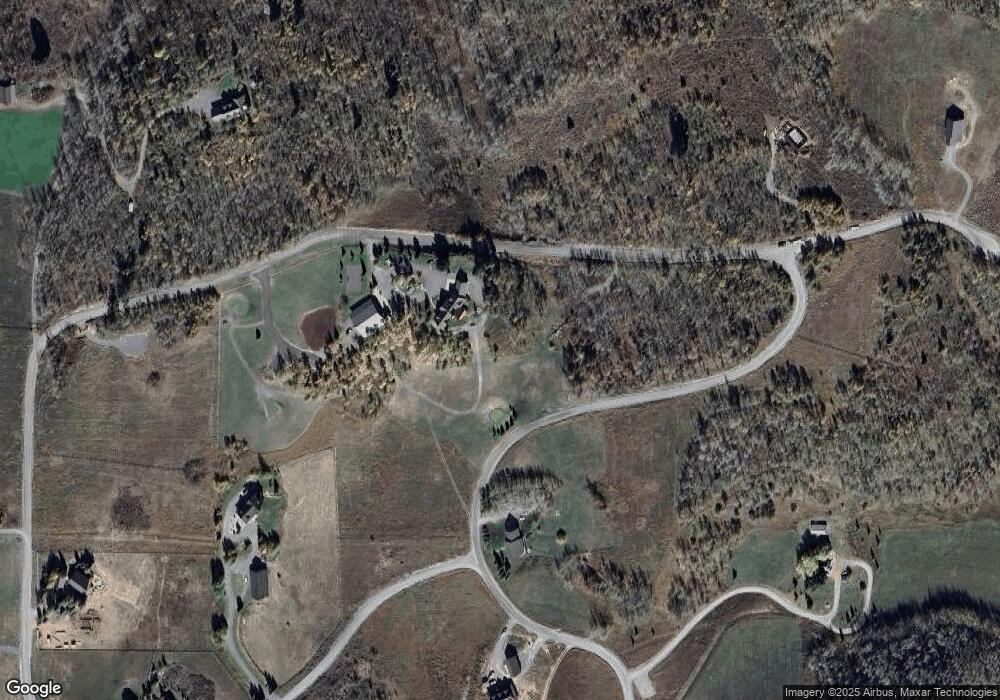
Map
Nearby Homes
- 4051 Golden Stone Rd
- 1657 Renegade Fly Dr
- 1634 Renegade Fly Dr
- 1631 Royal Coachman Dr
- 1614 Renegade Fly Dr
- 1641 Royal Coachman Dr
- 1593 Sharptail Ln E
- 1603 Royal Coachman Dr
- 1528 Idaho 47
- 1560 E Rim Loop Rd
- 1550 E Rim Loop Rd
- 1550 W Rim Loop
- 1542 W Rim Loop
- 4373 Hannah's Crossing
- 4327 Bridger Ridge
- 1395 N 4200 E
- 1531 Shadow Run
- 4354 Daltons Landing
- 4367 Ridge Crest
- 1656 Shadow Loop S
- 1697 Whisper Ridge Rd
- 1700 Whisper Ridge Rd
- 1660 Highlands Rd
- 1660 Highland Rd
- 1701 Whisper Ridge Rd
- 1695 Whisper Ridge Rd
- 1662 Whisper Ridge Rd
- 1680 Whisper Ridge Rd
- 1657 Highland St
- 1657 Highland Rd
- 1704 Christy Ln
- 1658 Highlands Rd
- 1661 Whisper Ridge Rd
- 1678 Whisper Ridge Rd
- 1668 Whisper Ridge Rd
- 1687 Whisper Ridge Rd
- 1705 Christy Ln
- 1652 Highland Rd
- 1679 Whisper Ridge Rd
- 1715 Christy Ln