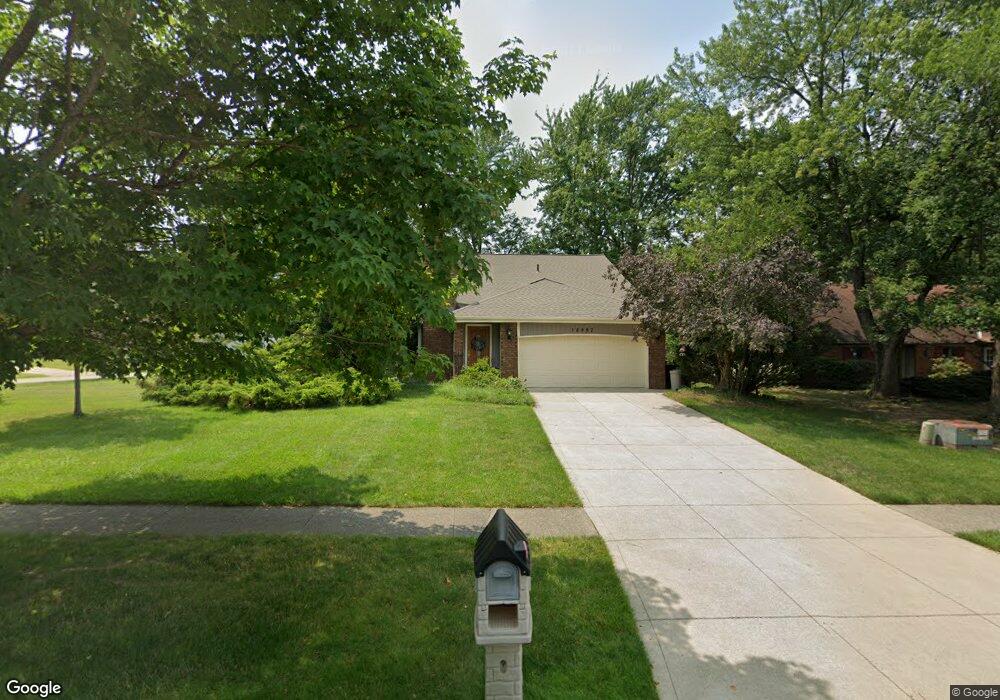
16987 Bear Creek Ln Strongsville, OH 44136
Estimated Value: $330,000 - $371,000
3
Beds
3
Baths
1,907
Sq Ft
$183/Sq Ft
Est. Value
About This Home
This home is located at 16987 Bear Creek Ln, Strongsville, OH 44136 and is currently estimated at $349,918, approximately $183 per square foot. 16987 Bear Creek Ln is a home located in Cuyahoga County with nearby schools including Strongsville High School and Sts Joseph & John Interparochial School.
Ownership History
Date
Name
Owned For
Owner Type
Purchase Details
Closed on
Apr 15, 2014
Sold by
Sandrick Dorothy C and Maclaine Ian G
Bought by
Mcclaine Dorothy C and Maclaine Ian G
Current Estimated Value
Purchase Details
Closed on
Jan 21, 1993
Sold by
Carbol Patrick
Bought by
Sandrick Dorothy C
Purchase Details
Closed on
Jul 10, 1990
Sold by
Buckley James J
Bought by
Carbol Patrick
Purchase Details
Closed on
Apr 15, 1982
Sold by
Kroeger John C and Kroeger Pamela
Bought by
Buckley James J
Purchase Details
Closed on
Sep 6, 1979
Sold by
Polo David M and Polo Rita A
Bought by
Kroeger John C and Kroeger Pamela
Purchase Details
Closed on
Jun 27, 1976
Bought by
Polo David M and Polo Rita A
Purchase Details
Closed on
Mar 23, 1976
Bought by
Production Homes Inc
Purchase Details
Closed on
Jan 1, 1976
Bought by
North East Land Co
Create a Home Valuation Report for This Property
The Home Valuation Report is an in-depth analysis detailing your home's value as well as a comparison with similar homes in the area
Home Values in the Area
Average Home Value in this Area
Purchase History
| Date | Buyer | Sale Price | Title Company |
|---|---|---|---|
| Mcclaine Dorothy C | -- | Attorney | |
| Sandrick Dorothy C | $137,000 | -- | |
| Carbol Patrick | $126,700 | -- | |
| Buckley James J | $82,500 | -- | |
| Kroeger John C | $84,500 | -- | |
| Polo David M | $60,000 | -- | |
| Production Homes Inc | $17,500 | -- | |
| North East Land Co | -- | -- |
Source: Public Records
Tax History Compared to Growth
Tax History
| Year | Tax Paid | Tax Assessment Tax Assessment Total Assessment is a certain percentage of the fair market value that is determined by local assessors to be the total taxable value of land and additions on the property. | Land | Improvement |
|---|---|---|---|---|
| 2024 | $4,347 | $102,375 | $23,275 | $79,100 |
| 2023 | $4,401 | $79,450 | $19,670 | $59,780 |
| 2022 | $4,395 | $79,450 | $19,670 | $59,780 |
| 2021 | $4,360 | $79,450 | $19,670 | $59,780 |
| 2020 | $3,931 | $65,140 | $16,140 | $49,000 |
| 2019 | $3,816 | $186,100 | $46,100 | $140,000 |
| 2018 | $3,463 | $65,140 | $16,140 | $49,000 |
| 2017 | $3,239 | $57,580 | $13,020 | $44,560 |
| 2016 | $3,213 | $57,580 | $13,020 | $44,560 |
| 2015 | $3,258 | $57,580 | $13,020 | $44,560 |
| 2014 | $3,258 | $57,580 | $13,020 | $44,560 |
Source: Public Records
Map
Nearby Homes
- 17024 Bear Creek Ln
- 17682 Drake Rd
- 18294 Drake Rd
- 17159 Turkey Meadow Ln
- 17069 Partridge Dr
- 17934 Cambridge Oval
- 18162 Fawn Cir
- 16650 Lanier Ave
- 18411 Yorktown Oval
- 16486 S Red Rock Dr
- 17259 Woodshire Dr
- 19297 Lauren Way
- 19311 Bradford Ct
- 18630 Shurmer Rd
- 16450 Howe Rd
- 17130 Golden Star Dr
- 15639 Indianhead Ln
- 18848 Pearl Rd
- 20393 Wildwood Ln
- 18229 Howe Rd
- 16979 Bear Creek Ln
- 17101 Rabbit Run Dr
- 17102 Rabbit Run Dr
- 17094 Rabbit Run Dr
- 17109 Rabbit Run Dr
- 16986 Bear Creek Ln
- 16994 Bear Creek Ln
- 17110 Rabbit Run Dr
- 16978 Bear Creek Ln
- 17002 Bear Creek Ln
- 16963 Bear Creek Ln
- 16968 Deer Path Dr
- 17118 Rabbit Run Dr
- 16970 Bear Creek Ln
- 17117 Rabbit Run Dr
- 16976 Bear Creek Ln
- 16994 Antler Ln
- 16966 Deer Path Dr
- 16972 Deer Path Dr
- 16778 Badger Den Ln