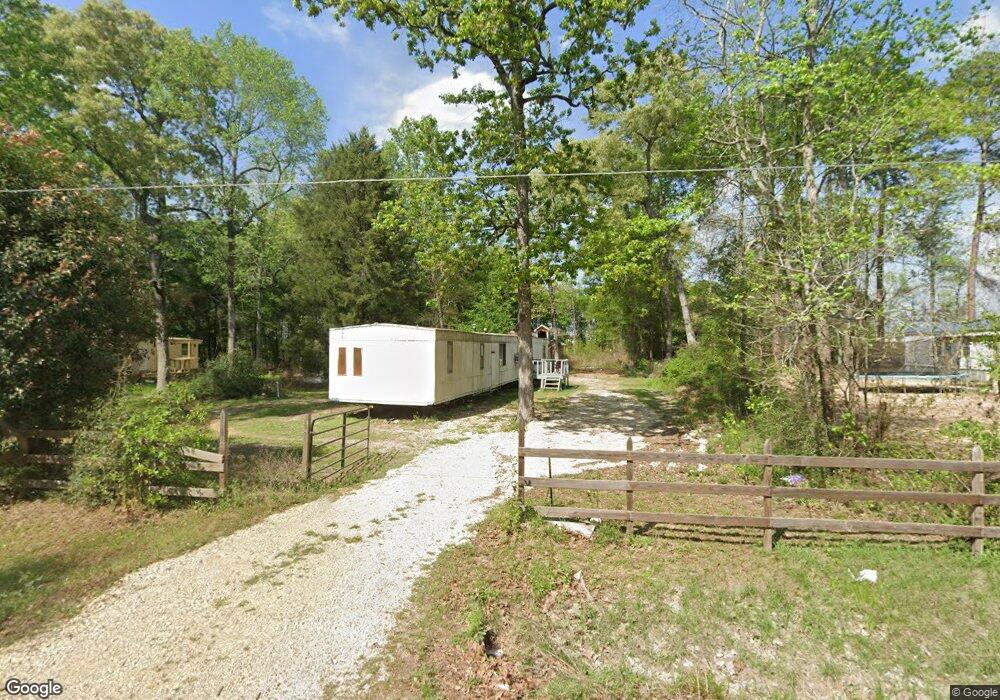
16987 Springfield Dr Conroe, TX 77302
Estimated Value: $123,630 - $347,000
Studio
1
Bath
512
Sq Ft
$416/Sq Ft
Est. Value
About This Home
This home is located at 16987 Springfield Dr, Conroe, TX 77302 and is currently estimated at $212,908, approximately $415 per square foot. 16987 Springfield Dr is a home located in Montgomery County with nearby schools including Grangerland Intermediate School, Moorhead Junior High School, and Caney Creek High School.
Ownership History
Date
Name
Owned For
Owner Type
Purchase Details
Closed on
Apr 8, 2025
Sold by
Salazar Flavio Cesar Zuniga and Maldonado Valentina Flores
Bought by
Sanchez Felicitas Hernandez
Current Estimated Value
Home Financials for this Owner
Home Financials are based on the most recent Mortgage that was taken out on this home.
Original Mortgage
$86,000
Outstanding Balance
$83,466
Interest Rate
6.85%
Mortgage Type
Seller Take Back
Estimated Equity
$129,442
Purchase Details
Closed on
Sep 21, 2018
Sold by
Zabody Leslie C and Mcmanus Theresa Lynn
Bought by
Zuniga Jasmin Sanchez and Maldonado Valetina Flores
Purchase Details
Closed on
Sep 14, 2018
Sold by
Lunceford Meaux Jennifer Leiigh and Lunceford Jensen Karen Deann
Bought by
Zabodyn Brandy Lee and Zabodyn Carrie Michelle
Purchase Details
Closed on
Mar 27, 1990
Sold by
Kap Inc
Bought by
Limbert Ida A
Create a Home Valuation Report for This Property
The Home Valuation Report is an in-depth analysis detailing your home's value as well as a comparison with similar homes in the area
Home Values in the Area
Average Home Value in this Area
Purchase History
| Date | Buyer | Sale Price | Title Company |
|---|---|---|---|
| Sanchez Felicitas Hernandez | -- | None Listed On Document | |
| Zuniga Jasmin Sanchez | -- | None Available | |
| Zabodyn Brandy Lee | -- | None Available | |
| Limbert Ida A | -- | None Available |
Source: Public Records
Mortgage History
| Date | Status | Borrower | Loan Amount |
|---|---|---|---|
| Open | Sanchez Felicitas Hernandez | $86,000 |
Source: Public Records
Tax History
| Year | Tax Paid | Tax Assessment Tax Assessment Total Assessment is a certain percentage of the fair market value that is determined by local assessors to be the total taxable value of land and additions on the property. | Land | Improvement |
|---|---|---|---|---|
| 2025 | $1,466 | $109,261 | $59,701 | $49,560 |
| 2024 | $1,466 | $92,590 | $59,701 | $32,889 |
| 2023 | $1,456 | $92,250 | $59,710 | $32,540 |
| 2022 | $1,459 | $84,010 | $59,710 | $24,300 |
| 2021 | $1,377 | $74,500 | $58,440 | $16,060 |
| 2020 | $1,463 | $75,250 | $58,440 | $16,810 |
| 2019 | $732 | $36,360 | $10,200 | $26,160 |
| 2018 | $5 | $29,980 | $10,200 | $26,160 |
| 2017 | $551 | $27,250 | $10,200 | $26,160 |
| 2016 | $501 | $24,770 | $10,200 | $27,700 |
| 2015 | -- | $22,520 | $10,200 | $19,280 |
| 2014 | -- | $20,470 | $10,200 | $12,040 |
Source: Public Records
Map
Nearby Homes
- 16922 Needlepoint Dr
- 16889 Springfield Dr
- 16934 Needlepoint Dr
- 307 Springfield Terrace Dr
- 16891 Needlepoint Dr
- 17014 Hazelnut Dr
- 16874 Needlepoint Dr
- 16875 Needlepoint Dr
- 14337 Ash Tree Dr
- 16866 Needlepoint Dr
- 17002 Hazelnut Dr
- 16858 Needlepoint Dr
- 16994 Hazelnut Dr
- 16849 Needlepoint Dr
- 14325 Ash Tree Dr
- 16841 Needlepoint Dr
- 16980 Hazelnut Dr
- 16981 Hazelnut Dr
- 16976 Hazelnut Dr
- 14308 Ash Tree Dr
- 16970 Springfield Dr
- 16952 Springfield Dr
- 16905 Springfield Dr
- 16905 Springfield Dr
- 17051 Springfield Dr
- 16908 Springfield Dr
- 16914 Needlepoint Dr
- 16890 Needlepoint Dr
- 16926 Needlepoint Dr
- 17121 Springfield Dr
- 16930 Needlepoint Dr
- 16885 Springfield Dr
- 16886 Springfield Dr
- 318 Springfield Terrace Dr
- 263 Springfield Terrace Dr
- 16938 Needlepoint Dr
- 16909 Needlepoint Dr
- 16917 Needlepoint Dr
- 17129 Springfield Dr
- 16921 Needlepoint Dr
Your Personal Tour Guide
Ask me questions while you tour the home.