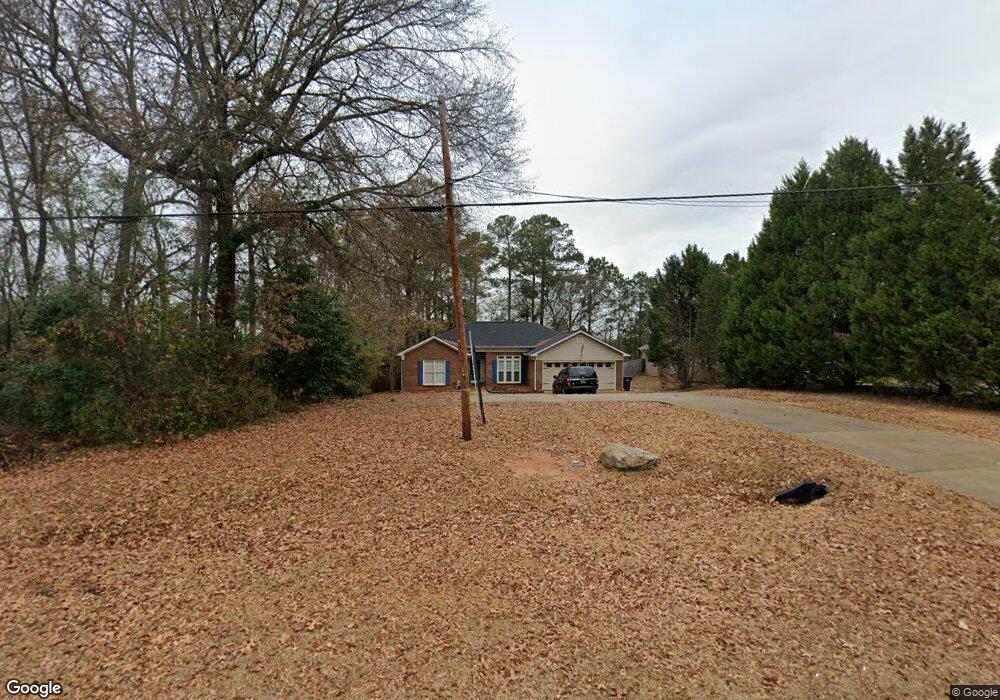
1699 Double Churches Rd Columbus, GA 31904
North Columbus NeighborhoodEstimated Value: $259,000 - $306,000
4
Beds
2
Baths
1,838
Sq Ft
$154/Sq Ft
Est. Value
About This Home
This home is located at 1699 Double Churches Rd, Columbus, GA 31904 and is currently estimated at $282,487, approximately $153 per square foot. 1699 Double Churches Rd is a home located in Muscogee County with nearby schools including Double Churches Elementary School, Double Churches Middle School, and Northside High School.
Ownership History
Date
Name
Owned For
Owner Type
Purchase Details
Closed on
Dec 12, 2025
Sold by
Wilbourn William J
Bought by
Wilbourn Christen A
Current Estimated Value
Purchase Details
Closed on
Mar 18, 2016
Sold by
Slaugenhoup Scott
Bought by
Wilbourn Christen and Wilbourn William
Home Financials for this Owner
Home Financials are based on the most recent Mortgage that was taken out on this home.
Original Mortgage
$171,830
Interest Rate
3.37%
Mortgage Type
FHA
Purchase Details
Closed on
May 3, 2011
Sold by
Hsbc Bank Usa
Bought by
Slaugenhoup Preston Scott
Home Financials for this Owner
Home Financials are based on the most recent Mortgage that was taken out on this home.
Original Mortgage
$123,712
Interest Rate
4.5%
Mortgage Type
FHA
Purchase Details
Closed on
Jan 4, 2011
Sold by
Pytlik Jacob
Bought by
Hsbc Bank Usa Na
Create a Home Valuation Report for This Property
The Home Valuation Report is an in-depth analysis detailing your home's value as well as a comparison with similar homes in the area
Home Values in the Area
Average Home Value in this Area
Purchase History
| Date | Buyer | Sale Price | Title Company |
|---|---|---|---|
| Wilbourn Christen A | -- | None Listed On Document | |
| Wilbourn Christen | $175,000 | -- | |
| Slaugenhoup Preston Scott | $128,199 | -- | |
| Hsbc Bank Usa Na | $180,784 | None Available |
Source: Public Records
Mortgage History
| Date | Status | Borrower | Loan Amount |
|---|---|---|---|
| Previous Owner | Wilbourn Christen | $171,830 | |
| Previous Owner | Slaugenhoup Preston Scott | $123,712 |
Source: Public Records
Tax History
| Year | Tax Paid | Tax Assessment Tax Assessment Total Assessment is a certain percentage of the fair market value that is determined by local assessors to be the total taxable value of land and additions on the property. | Land | Improvement |
|---|---|---|---|---|
| 2025 | $2,610 | $103,292 | $19,996 | $83,296 |
| 2024 | $2,608 | $103,292 | $19,996 | $83,296 |
| 2023 | $1,931 | $103,292 | $19,996 | $83,296 |
| 2022 | $2,720 | $85,548 | $19,996 | $65,552 |
| 2021 | $2,714 | $79,848 | $19,996 | $59,852 |
| 2020 | $2,714 | $79,848 | $19,996 | $59,852 |
| 2019 | $2,725 | $79,848 | $19,996 | $59,852 |
| 2018 | $2,725 | $79,848 | $19,996 | $59,852 |
| 2017 | $2,928 | $70,000 | $17,600 | $52,400 |
| 2016 | $1,568 | $74,360 | $7,000 | $67,360 |
| 2015 | $1,572 | $74,360 | $7,000 | $67,360 |
| 2014 | $1,575 | $74,360 | $7,000 | $67,360 |
| 2013 | -- | $74,360 | $7,000 | $67,360 |
Source: Public Records
Map
Nearby Homes
- 1438 Grove Park Dr Unit 13B
- 1438 Grove Park Dr Unit 11B
- 7426 Paprika Ln
- 6982 Buckhorn Dr
- 1442 Grove Park Dr Unit 2
- 1442 Grove Park Dr Unit 8
- 1708 Tom Buk Tu Ln
- 1727 Fountain Ct
- 1430 Cloverdale Rd
- 1355 Cloverdale Rd
- 7833 Crescent Dr
- 7741 Hilldale Dr
- 1811 Saffron Ct
- 7935 Crescent Dr
- 1195 Cloverdale Rd
- 6810 Fawndale Dr
- 6817 Whitesville Rd
- 7724 Gray Shoals Dr
- 6802 Ellis Dr
- 7717 Boulder Dr
- 1703 Double Churches Rd
- 7958 Big Creek Place
- 7969 Big Creek Ct
- 1709 Double Churches Rd
- 7964 Big Creek Place
- 7979 Big Creek Ct
- 7952 Big Creek Place
- 7970 Big Creek Place
- 1644 Double Churches Rd
- 7974 Big Creek Ct
- 7983 Big Creek Ct
- 1800 Double Churches Rd
- 1800 Double Churches Rd
- 1638 Double Churches Rd
- 7965 Big Creek Place
- 7971 Big Creek Place
- 7980 Big Creek Ct
- 7811 Big Creek Dr
- 1632 Double Churches Rd
- 7815 Big Creek Dr
Your Personal Tour Guide
Ask me questions while you tour the home.