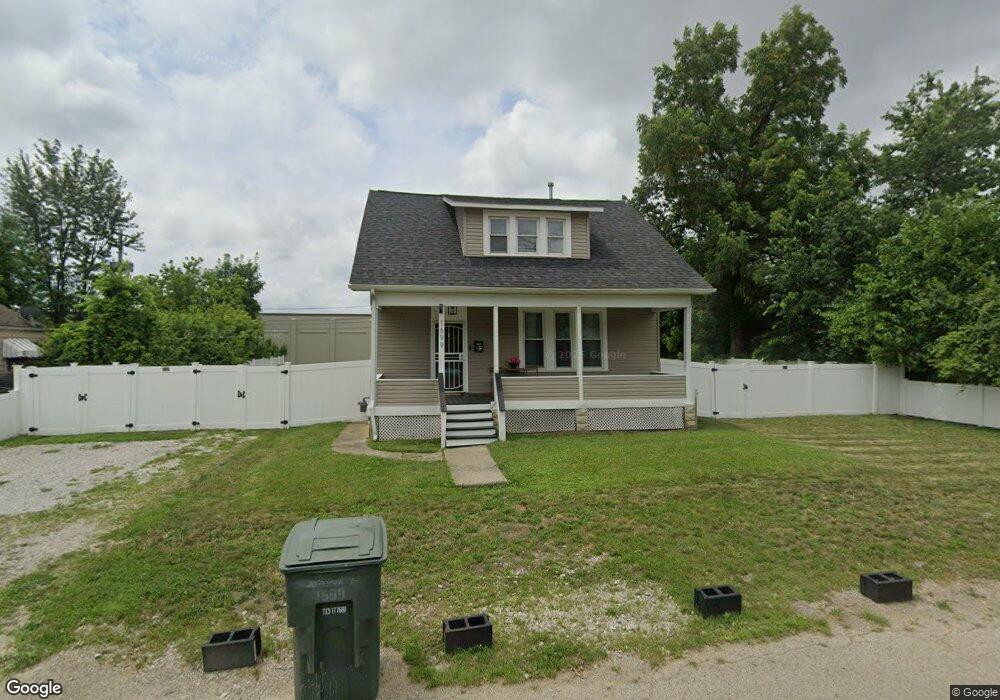
1699 Jefferson Ave Columbus, OH 43211
South Linden NeighborhoodEstimated Value: $142,452 - $213,000
4
Beds
2
Baths
1,462
Sq Ft
$124/Sq Ft
Est. Value
About This Home
This home is located at 1699 Jefferson Ave, Columbus, OH 43211 and is currently estimated at $180,613, approximately $123 per square foot. 1699 Jefferson Ave is a home located in Franklin County with nearby schools including Windsor Stem Acadmey, Linden-Mckinley Stem School On Arcadia, and North Columbus Preparatory Academy.
Ownership History
Date
Name
Owned For
Owner Type
Purchase Details
Closed on
Sep 3, 2020
Sold by
Raleigh Erving M
Bought by
Hairston Melissa Marie and Hairston Ronald G
Current Estimated Value
Home Financials for this Owner
Home Financials are based on the most recent Mortgage that was taken out on this home.
Original Mortgage
$130,950
Outstanding Balance
$115,149
Interest Rate
2.9%
Mortgage Type
New Conventional
Estimated Equity
$65,464
Purchase Details
Closed on
Jun 25, 2004
Sold by
Monaghan Stephan L and Monaghan Phyllis
Bought by
Raleigh Erving M
Home Financials for this Owner
Home Financials are based on the most recent Mortgage that was taken out on this home.
Original Mortgage
$73,500
Interest Rate
5.75%
Mortgage Type
Purchase Money Mortgage
Purchase Details
Closed on
Jun 24, 2003
Sold by
Bank One Na
Bought by
Monaghan Stephan L
Purchase Details
Closed on
Jan 27, 2003
Sold by
Moore Roger and Case #01Cve01 903
Bought by
Bank One Na and Peoples Choice Home Loan Inc
Create a Home Valuation Report for This Property
The Home Valuation Report is an in-depth analysis detailing your home's value as well as a comparison with similar homes in the area
Home Values in the Area
Average Home Value in this Area
Purchase History
| Date | Buyer | Sale Price | Title Company |
|---|---|---|---|
| Hairston Melissa Marie | $135,000 | First Ohio Title Ins Box | |
| Raleigh Erving M | $73,500 | Discovery T | |
| Monaghan Stephan L | $27,000 | Resource Title Agency Inc | |
| Bank One Na | $28,600 | -- |
Source: Public Records
Mortgage History
| Date | Status | Borrower | Loan Amount |
|---|---|---|---|
| Open | Hairston Melissa Marie | $130,950 | |
| Closed | Raleigh Erving M | $73,500 |
Source: Public Records
Tax History
| Year | Tax Paid | Tax Assessment Tax Assessment Total Assessment is a certain percentage of the fair market value that is determined by local assessors to be the total taxable value of land and additions on the property. | Land | Improvement |
|---|---|---|---|---|
| 2025 | $1,604 | $35,740 | $5,110 | $30,630 |
| 2024 | $1,604 | $35,740 | $5,110 | $30,630 |
| 2023 | $1,584 | $35,735 | $5,110 | $30,625 |
| 2022 | $735 | $14,180 | $2,140 | $12,040 |
| 2021 | $737 | $14,180 | $2,140 | $12,040 |
| 2020 | $738 | $14,180 | $2,140 | $12,040 |
| 2019 | $770 | $10,710 | $1,750 | $8,960 |
| 2018 | $751 | $10,710 | $1,750 | $8,960 |
| 2017 | $649 | $10,710 | $1,750 | $8,960 |
| 2016 | $939 | $14,180 | $1,470 | $12,710 |
| 2015 | $853 | $14,180 | $1,470 | $12,710 |
| 2014 | $855 | $14,180 | $1,470 | $12,710 |
| 2013 | $469 | $15,750 | $1,645 | $14,105 |
Source: Public Records
Map
Nearby Homes
- 1705 Lexington Ave
- 957 E 17th Ave
- 990 E 16th Ave
- 0 E 18th Ave
- 269 E 18th Ave
- 1012 E 17th Ave
- 906 E 18th Ave
- 1037 E 18th Ave
- 915 E 13th Ave
- 1070 E 16th Ave
- 957 E 13th Ave
- 1027 E 14th Ave
- 1538-1542 Accommodation Ave
- 1045-1051 E 20th Ave
- 1111-1113 E 16th Ave
- 957 E 12th Ave
- 1129 E 17th Ave
- 928 Chittenden Ave
- 990 E 21st Ave
- 1673 Cleveland Ave
- 0 N Jefferson Ave
- 1691 Jefferson Ave
- 1687 Jefferson Ave
- 1717 Jefferson Ave
- 1681 Jefferson Ave
- 1694 Jefferson Ave
- 1702 Jefferson Ave
- 1677 Jefferson Ave
- 1708 Jefferson Ave
- 1690 Jefferson Ave
- 1686 Jefferson Ave
- 1673 Jefferson Ave
- 1716 Jefferson Ave
- 923 E 17th Ave
- 919 E 17th Ave
- 927 E 17th Ave
- 915 E 17th Ave
- 924 E 15th Ave
- 930 E 15th Ave
- 1669 Jefferson Ave
Your Personal Tour Guide
Ask me questions while you tour the home.