Estimated Value: $517,000 - $644,000
5
Beds
3
Baths
2,621
Sq Ft
$226/Sq Ft
Est. Value
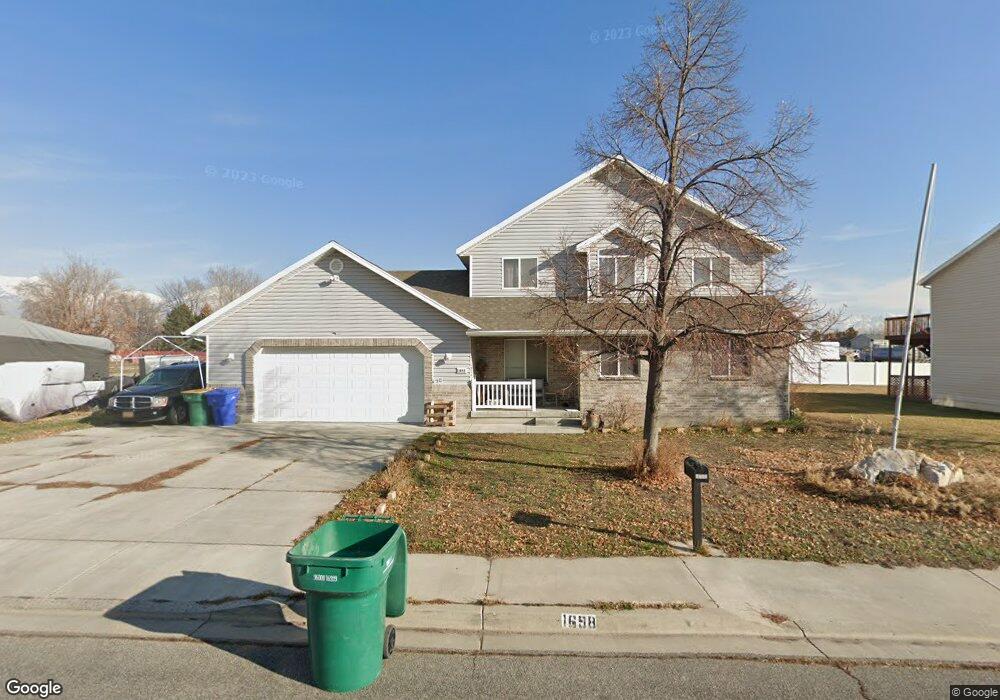
About This Home
This home is located at 1699 N 1125 W, Lehi, UT 84043 and is currently estimated at $591,201, approximately $225 per square foot. 1699 N 1125 W is a home located in Utah County with nearby schools including Lehi Elementary School, Lehi Junior High School, and Lehi High School.
Ownership History
Date
Name
Owned For
Owner Type
Purchase Details
Closed on
Feb 14, 2000
Sold by
Black Sketter Ray and Black Julie M
Bought by
Black Sketter Ray and Black Julie M
Current Estimated Value
Home Financials for this Owner
Home Financials are based on the most recent Mortgage that was taken out on this home.
Original Mortgage
$142,000
Outstanding Balance
$46,873
Interest Rate
8.14%
Estimated Equity
$544,328
Purchase Details
Closed on
Sep 28, 1999
Sold by
Black Sketter Ray and Black Raymond
Bought by
Black Sketter Ray and Black Julie M
Create a Home Valuation Report for This Property
The Home Valuation Report is an in-depth analysis detailing your home's value as well as a comparison with similar homes in the area
Home Values in the Area
Average Home Value in this Area
Purchase History
| Date | Buyer | Sale Price | Title Company |
|---|---|---|---|
| Black Sketter Ray | -- | Signature Title | |
| Black Sketter Ray | -- | Signature Title |
Source: Public Records
Mortgage History
| Date | Status | Borrower | Loan Amount |
|---|---|---|---|
| Open | Black Sketter Ray | $142,000 |
Source: Public Records
Tax History Compared to Growth
Tax History
| Year | Tax Paid | Tax Assessment Tax Assessment Total Assessment is a certain percentage of the fair market value that is determined by local assessors to be the total taxable value of land and additions on the property. | Land | Improvement |
|---|---|---|---|---|
| 2025 | $2,382 | $301,290 | $180,400 | $367,400 |
| 2024 | $2,382 | $278,795 | $0 | $0 |
| 2023 | $2,203 | $279,950 | $0 | $0 |
| 2022 | $2,065 | $254,430 | $0 | $0 |
| 2021 | $1,854 | $345,300 | $104,400 | $240,900 |
| 2020 | $1,748 | $321,800 | $96,700 | $225,100 |
| 2019 | $1,682 | $321,800 | $96,700 | $225,100 |
| 2018 | $1,588 | $287,300 | $91,600 | $195,700 |
| 2017 | $1,529 | $147,015 | $0 | $0 |
| 2016 | $1,582 | $141,130 | $0 | $0 |
| 2015 | $1,519 | $128,700 | $0 | $0 |
| 2014 | $1,376 | $115,885 | $0 | $0 |
Source: Public Records
Map
Nearby Homes
- 1610 N 1125 W
- 1249 W 1800 N
- 1272 W 1800 N
- 1011 W Mountain Way Unit 316
- 1817 W Bad Rock Cir
- 1094 W 1425 N
- 902 W 1500 N
- 1332 W 1500 N
- 1301 N 900 W Unit 12
- 1627 W Boxwood Dr Unit 110
- 1659 W Boxwood Dr Unit 109
- 1132 Titan Dr
- 1127 N 1500 W
- 1032 Titan Dr
- 2287 N 750 W
- 1542 N 1900 W
- 497 W 2200 N
- 1755 N 250 W
- 5312 N Springview Ct Unit 106
- 1027 N 3685 W Unit 248
- 1681 N 1125 W
- 1697 N 1125 W
- 1659 N 1125 W
- 1658 N 1125 W
- 1675 N 1125 W
- 1717 N 1125 W
- 1717 N 1125 W Unit 5
- 1737 N 1125 W
- 1655 N 1125 W
- 1758 N 1150 W
- 1637 N 1125 W
- 1736 N 1150 W
- 1148 W 1775 N
- 1636 N 1150 W
- 1113 W 1800 N
- 1137 W 1800 N
- 1749 N Trinnaman Ln
- 1695 N Trinnaman Ln
- 1695 N Trinnaman Ln
- 1082 W 1600 N