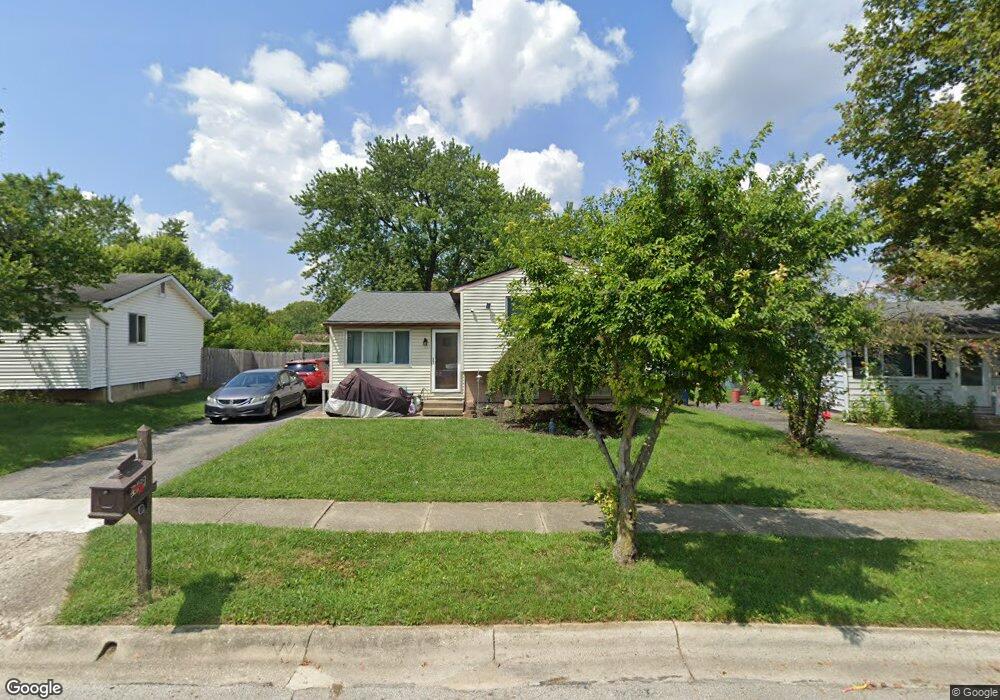
1699 Ripplebrook Rd Columbus, OH 43223
Riverbend NeighborhoodEstimated Value: $186,000 - $239,000
3
Beds
2
Baths
1,244
Sq Ft
$171/Sq Ft
Est. Value
About This Home
This home is located at 1699 Ripplebrook Rd, Columbus, OH 43223 and is currently estimated at $213,021, approximately $171 per square foot. 1699 Ripplebrook Rd is a home located in Franklin County with nearby schools including James A Harmon Elementary School, Franklin Woods Intermediate School, and Finland Middle School.
Ownership History
Date
Name
Owned For
Owner Type
Purchase Details
Closed on
Jun 18, 2008
Sold by
Hsbc Bank Usa Na
Bought by
Hanshaw Robert E
Current Estimated Value
Home Financials for this Owner
Home Financials are based on the most recent Mortgage that was taken out on this home.
Original Mortgage
$69,445
Interest Rate
5.96%
Mortgage Type
Purchase Money Mortgage
Purchase Details
Closed on
Dec 20, 2007
Sold by
Linkous Linda and Linkous Linda Ann
Bought by
Hsbc Bank Usa Na and Ace Securities Corp Home Equity Loan Tru
Purchase Details
Closed on
Feb 28, 2001
Sold by
Fritz Charles E and Fritz Robin M
Bought by
Linkous Linda
Home Financials for this Owner
Home Financials are based on the most recent Mortgage that was taken out on this home.
Original Mortgage
$83,341
Interest Rate
7.03%
Mortgage Type
FHA
Purchase Details
Closed on
Oct 1, 1990
Bought by
Fritz Charles E
Create a Home Valuation Report for This Property
The Home Valuation Report is an in-depth analysis detailing your home's value as well as a comparison with similar homes in the area
Home Values in the Area
Average Home Value in this Area
Purchase History
| Date | Buyer | Sale Price | Title Company |
|---|---|---|---|
| Hanshaw Robert E | $73,100 | Title Ques | |
| Hsbc Bank Usa Na | $68,000 | Independent | |
| Linkous Linda | $84,000 | Title First Agency Inc | |
| Fritz Charles E | $59,900 | -- |
Source: Public Records
Mortgage History
| Date | Status | Borrower | Loan Amount |
|---|---|---|---|
| Closed | Hanshaw Robert E | $69,445 | |
| Previous Owner | Linkous Linda | $83,341 |
Source: Public Records
Tax History Compared to Growth
Tax History
| Year | Tax Paid | Tax Assessment Tax Assessment Total Assessment is a certain percentage of the fair market value that is determined by local assessors to be the total taxable value of land and additions on the property. | Land | Improvement |
|---|---|---|---|---|
| 2024 | $2,118 | $58,100 | $16,730 | $41,370 |
| 2023 | $2,081 | $58,100 | $16,730 | $41,370 |
| 2022 | $1,748 | $35,810 | $9,730 | $26,080 |
| 2021 | $1,783 | $35,810 | $9,730 | $26,080 |
| 2020 | $1,773 | $35,810 | $9,730 | $26,080 |
| 2019 | $1,659 | $29,580 | $8,120 | $21,460 |
| 2018 | $1,586 | $29,580 | $8,120 | $21,460 |
| 2017 | $1,644 | $29,580 | $8,120 | $21,460 |
| 2016 | $1,520 | $25,130 | $5,390 | $19,740 |
| 2015 | $1,520 | $25,130 | $5,390 | $19,740 |
| 2014 | $1,522 | $25,130 | $5,390 | $19,740 |
| 2013 | $839 | $27,930 | $5,985 | $21,945 |
Source: Public Records
Map
Nearby Homes
- 1657 Ripplebrook Rd
- 3206 Andy Terrace
- 3488 Rocky Rd
- 3326 Bluhm Ct
- 3623 High Creek Dr
- 1485 Demorest Rd
- 1830 Winding Hollow Dr
- 1465 Tall Meadows Dr
- 2930 Alkire Rd
- 3728 Greenock Ct
- 2062 Summer Banks Dr
- 2800 Alkire Rd
- 1226 Pinnacle Dr
- 1181 Onslow Dr
- 1520 Fall Brook Rd
- 3766 Dunlane Ct
- 2987 Daisy Ln
- 2188 Dry Ridge Ct
- 2155 Pentress Dr
- 3728 Miltonsburg Dr
- 1705 Ripplebrook Rd
- 1693 Ripplebrook Rd
- 1711 Ripplebrook Rd
- 1684 Rivermont Rd
- 1690 Rivermont Rd
- 1678 Rivermont Rd
- 1675 Regents Hill Dr
- 1698 Rivermont Rd
- 1672 Rivermont Rd
- 1717 Ripplebrook Rd
- 1706 Ripplebrook Rd
- 1698 Ripplebrook Rd
- 1666 Rivermont Rd
- 1706 Rivermont Rd
- 1712 Ripplebrook Rd
- 1660 Rivermont Rd
- 1692 Ripplebrook Rd
- 1663 Regents Hill Dr
- 1723 Ripplebrook Rd
- 1714 Rivermont Rd