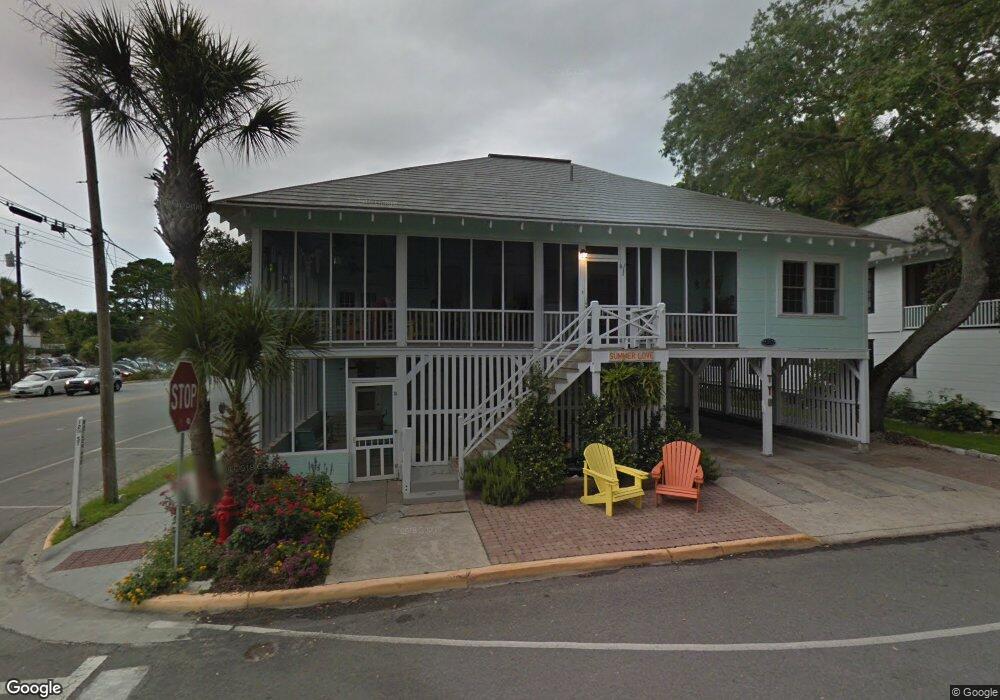
16B 12th St Tybee Island, GA 31328
Estimated Value: $1,211,136 - $1,571,000
4
Beds
5
Baths
2,998
Sq Ft
$441/Sq Ft
Est. Value
About This Home
This home is located at 16B 12th St, Tybee Island, GA 31328 and is currently estimated at $1,323,534, approximately $441 per square foot. 16B 12th St is a home located in Chatham County with nearby schools including Howard Elementary School, Coastal Middle School, and Islands High School.
Ownership History
Date
Name
Owned For
Owner Type
Purchase Details
Closed on
Mar 1, 2021
Sold by
Farrell Lori A
Bought by
3Fx Futures Llc
Current Estimated Value
Purchase Details
Closed on
Feb 5, 2016
Sold by
Farrell Timothy D
Bought by
Farrell Lori A
Purchase Details
Closed on
Nov 1, 2010
Sold by
The Savannah Bank
Bought by
Farrell Tim and Farrell Lori A
Home Financials for this Owner
Home Financials are based on the most recent Mortgage that was taken out on this home.
Original Mortgage
$417,000
Interest Rate
4.37%
Mortgage Type
New Conventional
Purchase Details
Closed on
Jul 6, 2010
Sold by
Ryan Builders Of Savannah
Bought by
The Savannah Bank Na
Purchase Details
Closed on
May 24, 2006
Bought by
Farrell Tim and Farrell Lori A
Purchase Details
Closed on
May 11, 2006
Bought by
Farrell Tim and Farrell Lori A
Create a Home Valuation Report for This Property
The Home Valuation Report is an in-depth analysis detailing your home's value as well as a comparison with similar homes in the area
Home Values in the Area
Average Home Value in this Area
Purchase History
| Date | Buyer | Sale Price | Title Company |
|---|---|---|---|
| 3Fx Futures Llc | -- | -- | |
| Farrell Lori A | -- | -- | |
| Farrell Tim | $625,000 | -- | |
| The Savannah Bank Na | $1,400,000 | -- | |
| Farrell Tim | $1,716,000 | -- | |
| Farrell Tim | $2,075,000 | -- |
Source: Public Records
Mortgage History
| Date | Status | Borrower | Loan Amount |
|---|---|---|---|
| Previous Owner | Farrell Tim | $417,000 |
Source: Public Records
Tax History Compared to Growth
Tax History
| Year | Tax Paid | Tax Assessment Tax Assessment Total Assessment is a certain percentage of the fair market value that is determined by local assessors to be the total taxable value of land and additions on the property. | Land | Improvement |
|---|---|---|---|---|
| 2025 | $15,311 | $487,720 | $135,000 | $352,720 |
| 2024 | $15,311 | $487,720 | $135,000 | $352,720 |
| 2023 | $19,611 | $516,280 | $135,000 | $381,280 |
| 2022 | $11,515 | $410,880 | $135,000 | $275,880 |
| 2021 | $12,629 | $342,640 | $74,880 | $267,760 |
| 2020 | $12,630 | $367,600 | $69,120 | $298,480 |
| 2019 | $12,629 | $367,600 | $69,120 | $298,480 |
| 2018 | $8,571 | $343,880 | $69,120 | $274,760 |
| 2017 | $8,571 | $266,000 | $69,680 | $196,320 |
| 2016 | $8,570 | $266,000 | $69,680 | $196,320 |
| 2015 | $8,067 | $372,200 | $69,680 | $302,520 |
| 2014 | $11,933 | $250,000 | $0 | $0 |
Source: Public Records
Map
Nearby Homes