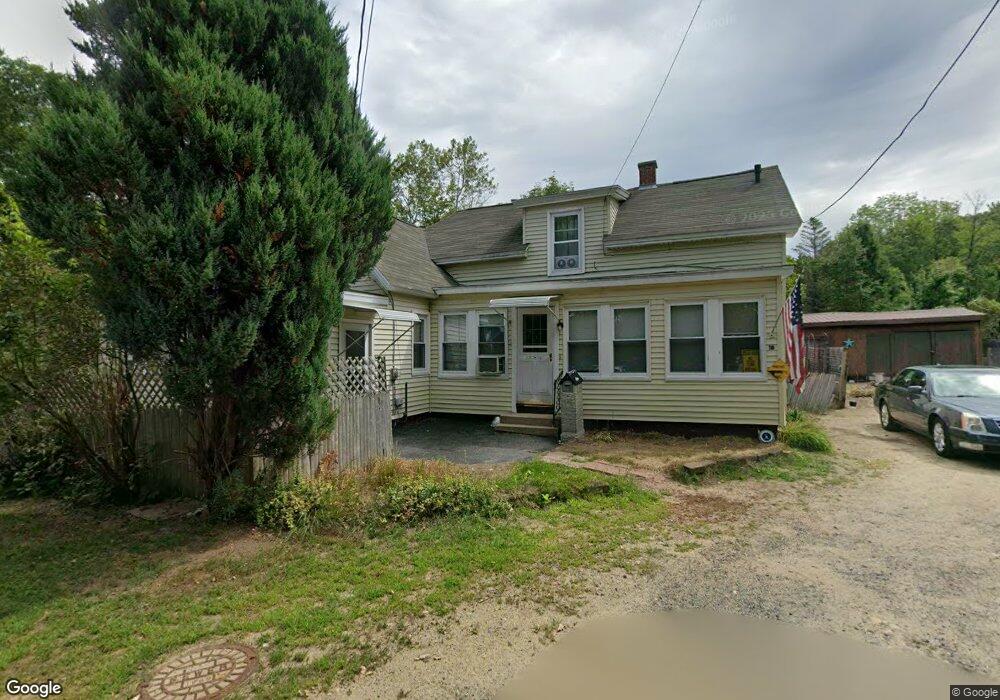
16B Duval Ct Winchendon, MA 01475
Estimated Value: $193,000 - $208,000
2
Beds
2
Baths
1,512
Sq Ft
$133/Sq Ft
Est. Value
About This Home
This home is located at 16B Duval Ct, Winchendon, MA 01475 and is currently estimated at $201,359, approximately $133 per square foot. 16B Duval Ct is a home located in Worcester County with nearby schools including Toy Town Elementary School, Memorial, and The Winchendon School.
Ownership History
Date
Name
Owned For
Owner Type
Purchase Details
Closed on
Jan 31, 2025
Sold by
Bardwell Leonard J Est and Eldridge
Bought by
Murphy Brian
Current Estimated Value
Purchase Details
Closed on
Jun 27, 2013
Sold by
Duval Raymond L Est and Bardwell
Bought by
Bardwell Leonard J
Purchase Details
Closed on
May 16, 1997
Sold by
Boston & Maine Corp
Bought by
Duval Raymond L
Create a Home Valuation Report for This Property
The Home Valuation Report is an in-depth analysis detailing your home's value as well as a comparison with similar homes in the area
Home Values in the Area
Average Home Value in this Area
Purchase History
| Date | Buyer | Sale Price | Title Company |
|---|---|---|---|
| Murphy Brian | $195,000 | None Available | |
| Murphy Brian | $195,000 | None Available | |
| Bardwell Leonard J | -- | -- | |
| Bardwell Leonard J | -- | -- | |
| Duval Raymond L | $5,000 | -- | |
| Duval Raymond L | $5,000 | -- |
Source: Public Records
Tax History Compared to Growth
Tax History
| Year | Tax Paid | Tax Assessment Tax Assessment Total Assessment is a certain percentage of the fair market value that is determined by local assessors to be the total taxable value of land and additions on the property. | Land | Improvement |
|---|---|---|---|---|
| 2025 | $2,386 | $203,100 | $30,500 | $172,600 |
| 2024 | $2,307 | $184,000 | $29,200 | $154,800 |
| 2023 | $2,437 | $181,900 | $28,600 | $153,300 |
| 2022 | $2,254 | $149,200 | $35,900 | $113,300 |
| 2021 | $2,036 | $129,500 | $32,700 | $96,800 |
| 2020 | $1,973 | $121,200 | $30,500 | $90,700 |
| 2019 | $1,856 | $111,100 | $28,200 | $82,900 |
| 2018 | $1,740 | $100,300 | $26,300 | $74,000 |
| 2017 | $1,624 | $90,400 | $28,600 | $61,800 |
| 2016 | $1,516 | $87,000 | $27,200 | $59,800 |
| 2015 | $1,455 | $87,000 | $27,200 | $59,800 |
| 2014 | $1,373 | $86,000 | $28,800 | $57,200 |
Source: Public Records
Map
Nearby Homes