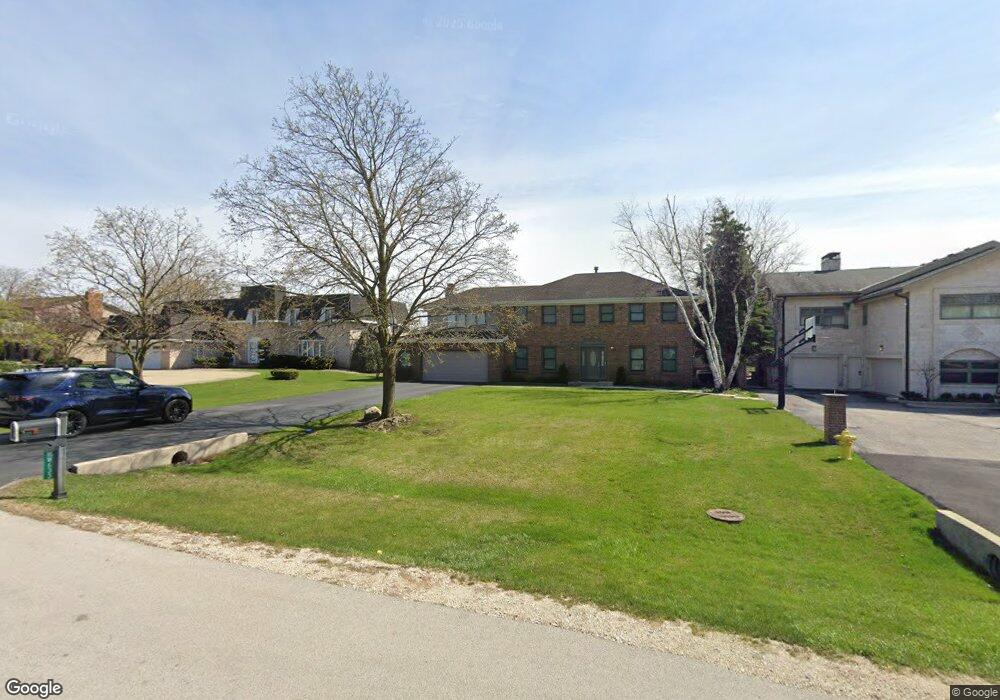
16W633 87th St Unit 8 Willowbrook, IL 60527
Waterfall Glen NeighborhoodEstimated Value: $808,071 - $1,246,000
Studio
1
Bath
3,508
Sq Ft
$274/Sq Ft
Est. Value
About This Home
This home is located at 16W633 87th St Unit 8, Willowbrook, IL 60527 and is currently estimated at $962,018, approximately $274 per square foot. 16W633 87th St Unit 8 is a home located in DuPage County with nearby schools including Anne M. Jeans Elementary School, Burr Ridge Middle School, and Hinsdale South High School.
Ownership History
Date
Name
Owned For
Owner Type
Purchase Details
Closed on
Aug 15, 2011
Sold by
Strappazon Peter and Strappazon Janice
Bought by
Polizois Athanasia H and Polizois Frank
Current Estimated Value
Home Financials for this Owner
Home Financials are based on the most recent Mortgage that was taken out on this home.
Original Mortgage
$417,000
Outstanding Balance
$288,860
Interest Rate
4.58%
Mortgage Type
New Conventional
Estimated Equity
$673,158
Purchase Details
Closed on
Jul 27, 2001
Sold by
Summerville Cynthia A
Bought by
Strappazon Peter and Strappazon Janice
Home Financials for this Owner
Home Financials are based on the most recent Mortgage that was taken out on this home.
Original Mortgage
$250,000
Interest Rate
7.15%
Purchase Details
Closed on
Nov 23, 1999
Sold by
Summerville Joseph E
Bought by
Summerville Cynthia A
Create a Home Valuation Report for This Property
The Home Valuation Report is an in-depth analysis detailing your home's value as well as a comparison with similar homes in the area
Home Values in the Area
Average Home Value in this Area
Purchase History
| Date | Buyer | Sale Price | Title Company |
|---|---|---|---|
| Polizois Athanasia H | $560,000 | Atg | |
| Strappazon Peter | $440,000 | -- | |
| Summerville Cynthia A | -- | Chicago Title Insurance Co |
Source: Public Records
Mortgage History
| Date | Status | Borrower | Loan Amount |
|---|---|---|---|
| Open | Polizois Athanasia H | $417,000 | |
| Previous Owner | Strappazon Peter | $250,000 |
Source: Public Records
Tax History
| Year | Tax Paid | Tax Assessment Tax Assessment Total Assessment is a certain percentage of the fair market value that is determined by local assessors to be the total taxable value of land and additions on the property. | Land | Improvement |
|---|---|---|---|---|
| 2024 | $13,231 | $238,120 | $74,014 | $164,106 |
| 2023 | $12,733 | $218,900 | $68,040 | $150,860 |
| 2022 | $12,044 | $210,300 | $65,370 | $144,930 |
| 2021 | $11,544 | $207,910 | $64,630 | $143,280 |
| 2020 | $11,368 | $203,790 | $63,350 | $140,440 |
| 2019 | $10,929 | $195,530 | $60,780 | $134,750 |
| 2018 | $9,665 | $180,110 | $60,630 | $119,480 |
| 2017 | $9,581 | $173,310 | $58,340 | $114,970 |
| 2016 | $9,349 | $165,400 | $55,680 | $109,720 |
| 2015 | $9,269 | $155,610 | $52,380 | $103,230 |
| 2014 | $9,586 | $158,120 | $50,930 | $107,190 |
| 2013 | $9,192 | $157,380 | $50,690 | $106,690 |
Source: Public Records
Map
Nearby Homes
- 16W648 89th Place
- 8625 Meadowbrook Dr
- 17W060 Burr Oak Ln
- 225 Sunrise Ave
- 8412 Meadowbrook Dr
- 10S330 Oneill Dr
- 9048 Oneill Dr
- 8601 Meadowbrook Dr
- 8829 Skyline Dr
- 16W130 89th St
- 16W234 91st St
- 8313 Highpoint Cir Unit F
- 16W125 89th St
- 12B Kingery Quarter Unit 108
- 2B Kingery Quarter Unit 207
- 3A Kingery Quarter Unit 103
- 14A Kingery Quarter Unit 204
- 16W122 91st St
- 8334 Portsmouth Dr Unit C
- 9S220 Lake Dr Unit 16-104
- 16w633 87th St
- 16W623 87th St
- 16W623 87th St Unit 1
- 16W645 87th St
- 16W657 87th St
- 9S775 William Dr
- 16W650 87th St
- 15W439 87th St
- 15W537 87th St
- 15W525 87th St
- 16W585 87th St
- 16W669 87th St
- 16W660 87th St
- 9S765 William Dr
- 9S758 William Dr
- 16W571 87th St
- 16W580 87th St
- 16W580 87 Th St
- 9S737 William Dr
- 430 Highland Rd
Your Personal Tour Guide
Ask me questions while you tour the home.