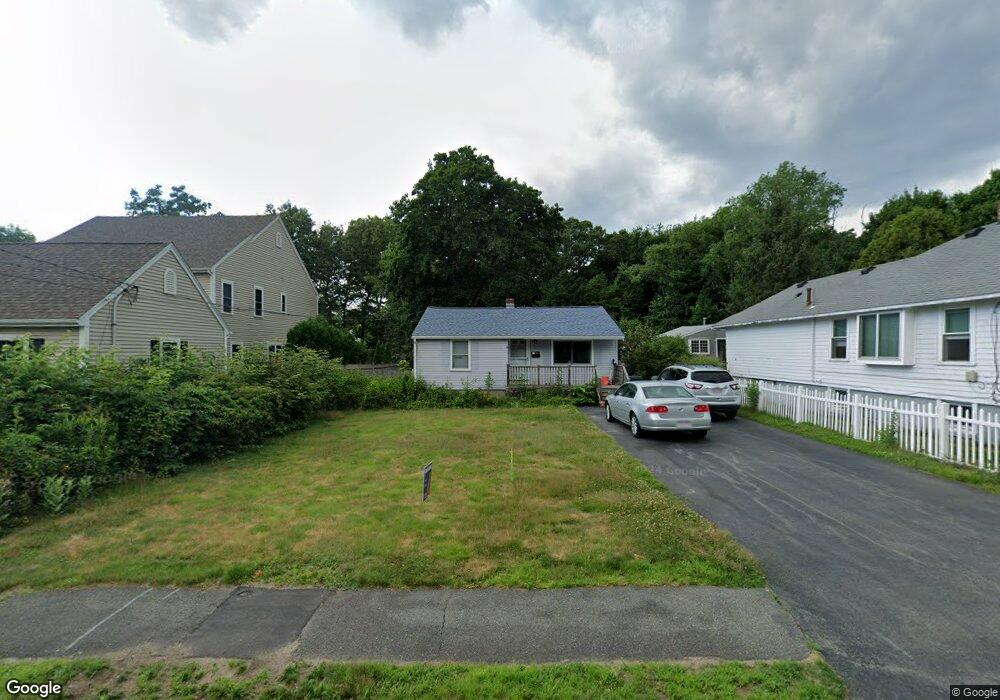
17 1/2 Proctor St Natick, MA 01760
Estimated Value: $499,000 - $813,643
3
Beds
1
Bath
992
Sq Ft
$680/Sq Ft
Est. Value
About This Home
This home is located at 17 1/2 Proctor St, Natick, MA 01760 and is currently estimated at $674,411, approximately $679 per square foot. 17 1/2 Proctor St is a home located in Middlesex County with nearby schools including Natick High School, Johnson Elementary School, and J F Kennedy Middle School.
Ownership History
Date
Name
Owned For
Owner Type
Purchase Details
Closed on
Jun 25, 2008
Sold by
Duke David A
Bought by
Duke Donna R
Current Estimated Value
Purchase Details
Closed on
Dec 31, 1976
Bought by
Dame Russell E and Dame Maureen F
Create a Home Valuation Report for This Property
The Home Valuation Report is an in-depth analysis detailing your home's value as well as a comparison with similar homes in the area
Home Values in the Area
Average Home Value in this Area
Purchase History
| Date | Buyer | Sale Price | Title Company |
|---|---|---|---|
| Duke Donna R | -- | -- | |
| Dame Russell E | -- | -- |
Source: Public Records
Mortgage History
| Date | Status | Borrower | Loan Amount |
|---|---|---|---|
| Previous Owner | Dame Russell E | $70,000 |
Source: Public Records
Tax History Compared to Growth
Tax History
| Year | Tax Paid | Tax Assessment Tax Assessment Total Assessment is a certain percentage of the fair market value that is determined by local assessors to be the total taxable value of land and additions on the property. | Land | Improvement |
|---|---|---|---|---|
| 2025 | $6,098 | $509,900 | $429,400 | $80,500 |
| 2024 | $5,917 | $482,600 | $404,100 | $78,500 |
| 2023 | $5,837 | $461,800 | $388,600 | $73,200 |
| 2022 | $5,664 | $424,600 | $352,900 | $71,700 |
| 2021 | $5,579 | $409,900 | $332,700 | $77,200 |
| 2020 | $5,552 | $407,900 | $317,600 | $90,300 |
| 2019 | $5,184 | $407,900 | $317,600 | $90,300 |
| 2018 | $4,718 | $361,500 | $302,500 | $59,000 |
| 2017 | $4,317 | $320,000 | $258,100 | $61,900 |
| 2016 | $4,051 | $298,500 | $237,100 | $61,400 |
| 2015 | $4,059 | $293,700 | $237,100 | $56,600 |
Source: Public Records
Map
Nearby Homes
- 1 Fern St
- 91 Speen St
- 4 Sylvia Ave
- 16 West St
- 40 Silver Hill Ln Unit 4
- 46 Silver Hill Ln Unit 1
- 26 Walden Dr Unit 4
- 9 Silver Hill Ln Unit 19
- 32 Silver Hill Ln Unit 1
- 12 Walden Dr Unit 19
- 25 Forest Ave
- 2 Lodge Rd
- 216-218 S Main St
- 47 High St
- 6 Ambler Ct
- 10 Kelsey Rd
- 57 Village Brook Ln Unit 5
- 50 Village Brook Ln Unit 4
- 105 N Main St
- 58 W Central St