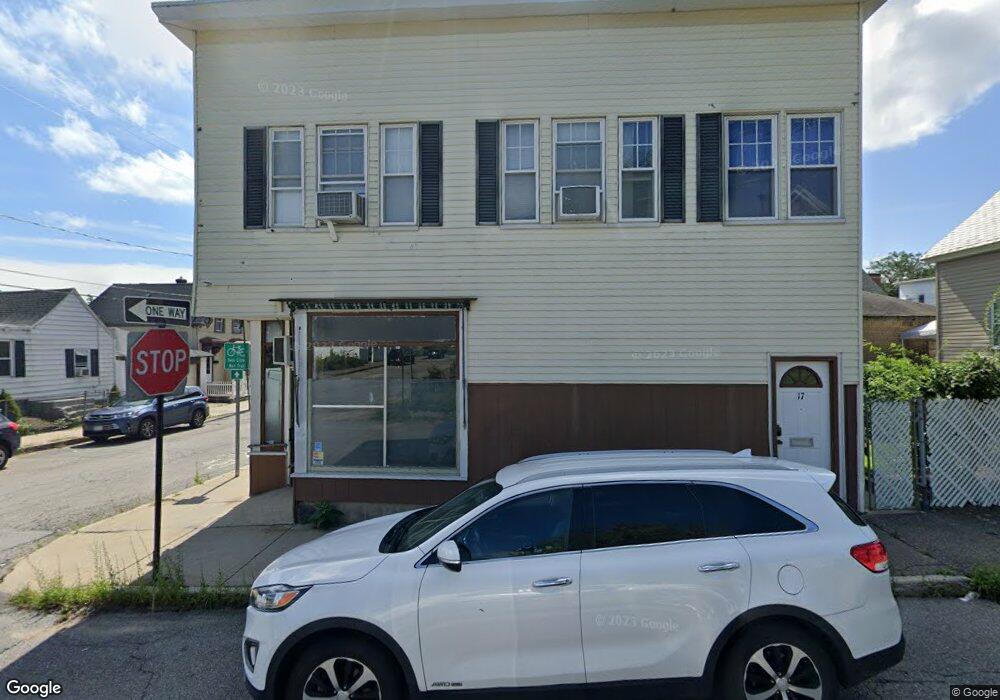
17 3rd St Fitchburg, MA 01420
Estimated Value: $335,674 - $423,000
3
Beds
2
Baths
3,040
Sq Ft
$123/Sq Ft
Est. Value
About This Home
This home is located at 17 3rd St, Fitchburg, MA 01420 and is currently estimated at $372,419, approximately $122 per square foot. 17 3rd St is a home located in Worcester County with nearby schools including South Street Elementary School, Crocker Elementary School, and Reingold Elementary School.
Ownership History
Date
Name
Owned For
Owner Type
Purchase Details
Closed on
Apr 1, 2019
Sold by
Champage Joshua
Bought by
Champagne Joshua D and Decaria Christopher V
Current Estimated Value
Home Financials for this Owner
Home Financials are based on the most recent Mortgage that was taken out on this home.
Original Mortgage
$110,500
Outstanding Balance
$97,149
Interest Rate
4.3%
Mortgage Type
New Conventional
Estimated Equity
$275,270
Purchase Details
Closed on
Apr 11, 2017
Sold by
Decaria Joseph F and Decaria Christopher V
Bought by
Champagne Joshua
Purchase Details
Closed on
Nov 12, 2014
Sold by
Decaria Catherine
Bought by
Decaria Joseph F and Decaria Christopher V
Create a Home Valuation Report for This Property
The Home Valuation Report is an in-depth analysis detailing your home's value as well as a comparison with similar homes in the area
Home Values in the Area
Average Home Value in this Area
Purchase History
| Date | Buyer | Sale Price | Title Company |
|---|---|---|---|
| Champagne Joshua D | -- | -- | |
| Champagne Joshua | -- | -- | |
| Decaria Joseph F | -- | -- |
Source: Public Records
Mortgage History
| Date | Status | Borrower | Loan Amount |
|---|---|---|---|
| Open | Champagne Joshua D | $110,500 |
Source: Public Records
Tax History Compared to Growth
Tax History
| Year | Tax Paid | Tax Assessment Tax Assessment Total Assessment is a certain percentage of the fair market value that is determined by local assessors to be the total taxable value of land and additions on the property. | Land | Improvement |
|---|---|---|---|---|
| 2025 | $3,364 | $249,000 | $85,600 | $163,400 |
| 2024 | $3,166 | $213,800 | $50,300 | $163,500 |
| 2023 | $3,012 | $188,000 | $38,600 | $149,400 |
| 2022 | $3,054 | $173,400 | $33,900 | $139,500 |
| 2021 | $2,877 | $151,200 | $25,700 | $125,500 |
| 2020 | $2,651 | $134,500 | $21,000 | $113,500 |
| 2019 | $2,498 | $121,900 | $29,200 | $92,700 |
| 2018 | $2,275 | $108,300 | $26,900 | $81,400 |
| 2017 | $2,119 | $98,600 | $24,500 | $74,100 |
| 2016 | $1,972 | $92,900 | $24,500 | $68,400 |
| 2015 | $2,060 | $99,600 | $25,700 | $73,900 |
| 2014 | $1,975 | $99,600 | $25,700 | $73,900 |
Source: Public Records
Map
Nearby Homes