Estimated Value: $425,557 - $463,000
4
Beds
2
Baths
1,576
Sq Ft
$287/Sq Ft
Est. Value
About This Home
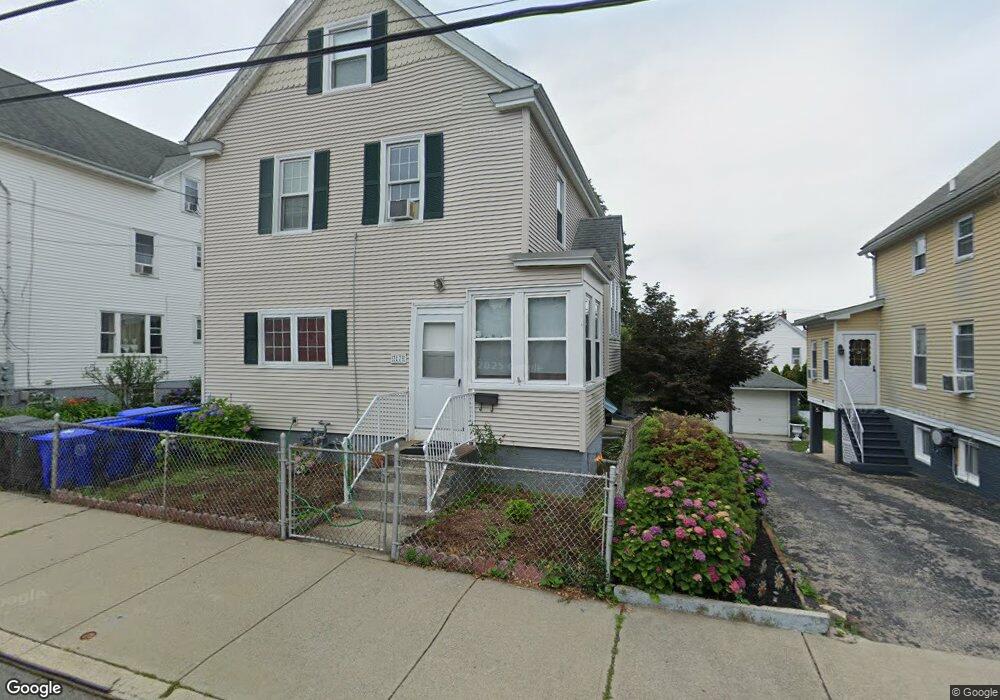
This home is located at 17 5th St, East Providence, RI 02914 and is currently estimated at $452,139, approximately $286 per square foot. 17 5th St is a home located in Providence County with nearby schools including East Providence High School, Ocean State Montessori School, and French-American School of Rhode Island.
Ownership History
Date
Name
Owned For
Owner Type
Purchase Details
Closed on
Dec 19, 2022
Sold by
Braga Pedro F
Bought by
Harrop Crystal A and Harrop Brenda L
Current Estimated Value
Purchase Details
Closed on
Mar 25, 2022
Sold by
Harrop Crystal A and Harrop Brenda L
Bought by
Harrop Crystal A and Harrop Crystal A
Home Financials for this Owner
Home Financials are based on the most recent Mortgage that was taken out on this home.
Original Mortgage
$90,000
Interest Rate
3.92%
Mortgage Type
Stand Alone Refi Refinance Of Original Loan
Purchase Details
Closed on
Nov 1, 1999
Sold by
Bandarra Albertina
Bought by
Harrop Crystal A and Harrop Brenda
Create a Home Valuation Report for This Property
The Home Valuation Report is an in-depth analysis detailing your home's value as well as a comparison with similar homes in the area
Home Values in the Area
Average Home Value in this Area
Purchase History
| Date | Buyer | Sale Price | Title Company |
|---|---|---|---|
| Harrop Crystal A | -- | None Available | |
| Harrop Crystal A | -- | None Available | |
| Harrop Crystal A | -- | None Available | |
| Harrop Crystal A | -- | None Available | |
| Harrop Crystal A | $107,000 | -- | |
| Harrop Crystal A | $107,000 | -- |
Source: Public Records
Mortgage History
| Date | Status | Borrower | Loan Amount |
|---|---|---|---|
| Previous Owner | Harrop Crystal A | $90,000 | |
| Previous Owner | Harrop Crystal A | $83,600 | |
| Previous Owner | Harrop Crystal A | $60,000 | |
| Previous Owner | Harrop Crystal A | $20,000 |
Source: Public Records
Tax History Compared to Growth
Tax History
| Year | Tax Paid | Tax Assessment Tax Assessment Total Assessment is a certain percentage of the fair market value that is determined by local assessors to be the total taxable value of land and additions on the property. | Land | Improvement |
|---|---|---|---|---|
| 2024 | $5,106 | $333,100 | $71,500 | $261,600 |
| 2023 | $4,917 | $333,100 | $71,500 | $261,600 |
| 2022 | $5,115 | $234,000 | $37,400 | $196,600 |
| 2021 | $5,031 | $234,000 | $37,400 | $196,600 |
| 2020 | $4,818 | $234,000 | $37,400 | $196,600 |
| 2019 | $4,685 | $234,000 | $37,400 | $196,600 |
| 2018 | $4,542 | $198,500 | $39,300 | $159,200 |
| 2017 | $4,440 | $198,500 | $39,300 | $159,200 |
| 2016 | $4,419 | $198,500 | $39,300 | $159,200 |
| 2015 | $4,528 | $197,300 | $48,500 | $148,800 |
| 2014 | $4,528 | $197,300 | $48,500 | $148,800 |
Source: Public Records
Map
Nearby Homes
- 89 Warren Ave
- 320 Mauran Ave
- 77 Seventh St
- 81 Burgess Ave
- 38 N Prospect St
- 0 Juniper St
- 58 Summit St
- 195 Lyon Ave Unit 197
- 152 Freeborn Ave
- 15 S Carpenter St
- 318 Mauran Ave
- 322 Mauran Ave
- 134 Berkeley St
- 91 Ivy St
- 43 Mary Ave Unit 45
- 78 Ingraham St
- 39 Schofield St
- 96 Gano St Unit 7
- 400 Juniper St Unit C
- 400 Juniper St Unit B